
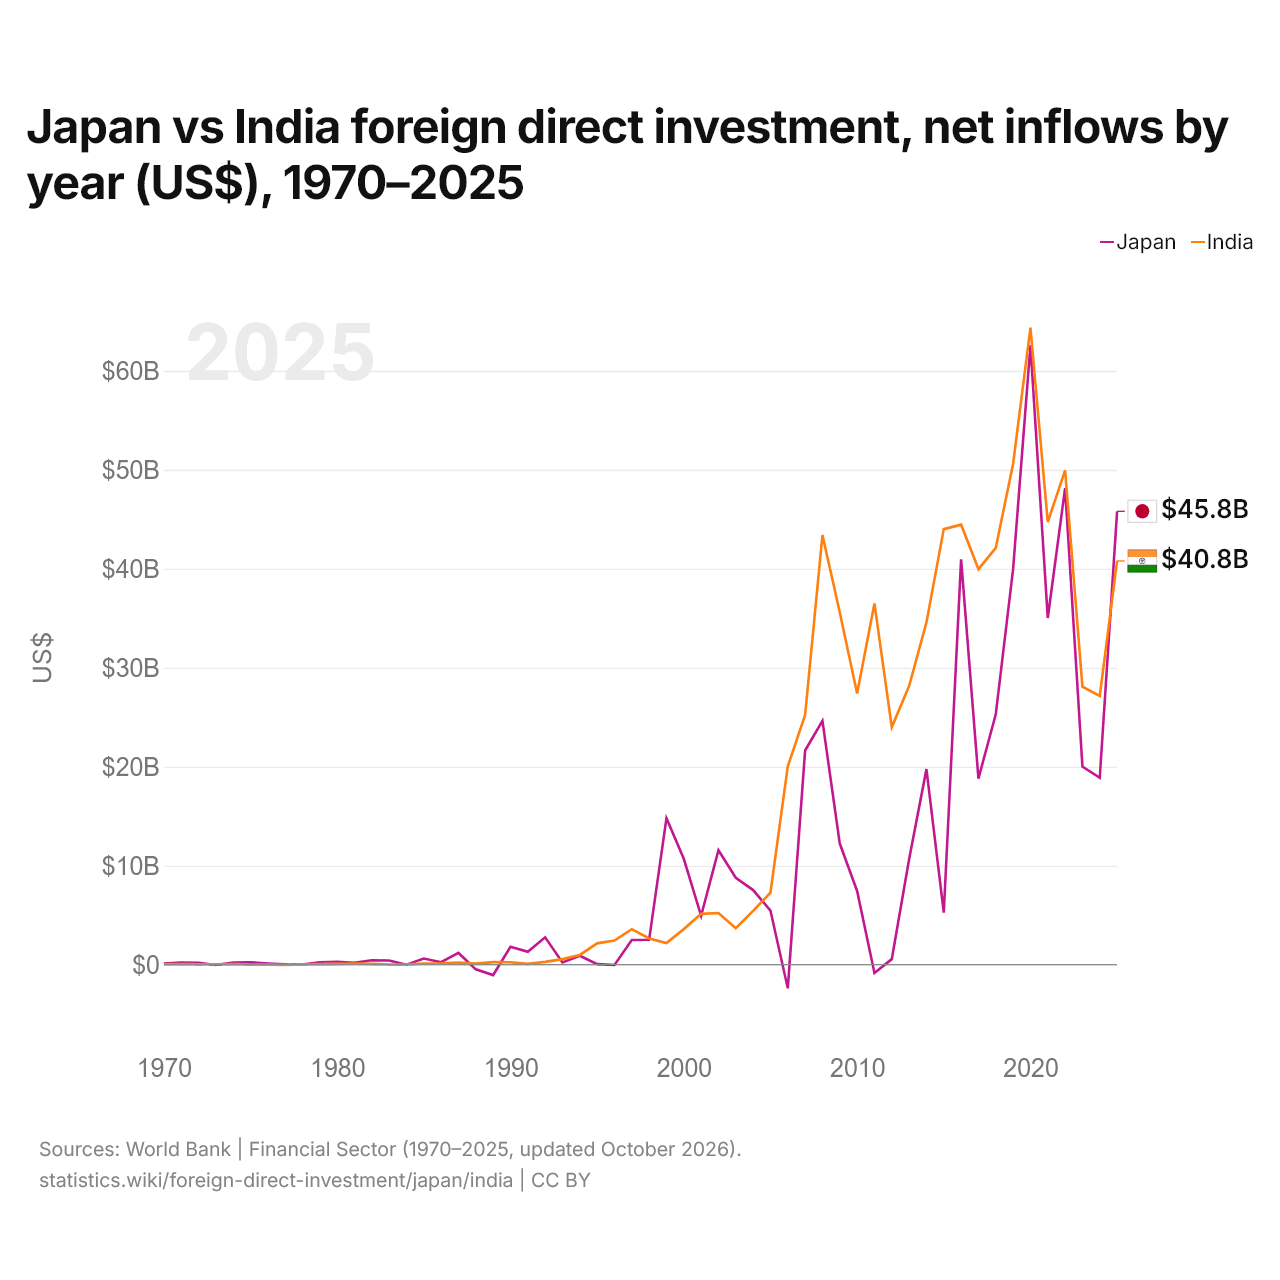
Japon vs Inde : investissements directs étrangers, entrées nettes par année ($ US), 1970–2025
| Année | $ US | |
|---|---|---|
 Japon |
 Inde |
|
| 2025 | 45 805 721 095 $ US | 40 791 693 367 $ US |
| 2024 | 18 874 093 729 $ US | 27 139 853 378 $ US |
| 2023 | 20 007 989 123 $ US | 28 086 193 530 $ US |
| 2022 | 48 153 832 744 $ US | 49 940 258 404 $ US |
| 2021 | 35 027 163 876 $ US | 44 727 277 563 $ US |
| 2020 | 62 584 719 398 $ US | 64 362 364 994 $ US |
| 2019 | 39 960 544 340 $ US | 50 610 647 354 $ US |
| 2018 | 25 289 367 858 $ US | 42 117 450 737 $ US |
| 2017 | 18 802 251 208 $ US | 39 966 091 359 $ US |
| 2016 | 40 954 181 469 $ US | 44 458 571 546 $ US |
| 2015 | 5 252 218 412 $ US | 44 009 492 130 $ US |
| 2014 | 19 752 249 424 $ US | 34 576 643 694 $ US |
| 2013 | 10 648 441 636 $ US | 28 153 031 270 $ US |
| 2012 | 546 962 692 $ US | 23 995 685 014 $ US |
| 2011 | −850 717 035 $ US | 36 498 654 598 $ US |
| 2010 | 7 440 979 284 $ US | 27 396 885 034 $ US |
| 2009 | 12 226 471 579 $ US | 35 581 372 930 $ US |
| 2008 | 24 624 845 330 $ US | 43 406 277 076 $ US |
| 2007 | 21 631 204 436 $ US | 25 227 740 887 $ US |
| 2006 | −2 396 909 736 $ US | 20 029 119 267 $ US |
| 2005 | 5 459 618 343 $ US | 7 269 407 226 $ US |
| 2004 | 7 527 948 175 $ US | 5 429 250 990 $ US |
| 2003 | 8 771 535 612 $ US | 3 681 984 671 $ US |
| 2002 | 11 557 373 874 $ US | 5 208 967 106 $ US |
| 2001 | 4 926 033 619 $ US | 5 128 093 562 $ US |
| 2000 | 10 688 168 326 $ US | 3 584 217 307 $ US |
| 1999 | 14 780 510 031 $ US | 2 168 591 054 $ US |
| 1998 | 2 512 021 924 $ US | 2 634 651 658 $ US |
| 1997 | 2 486 935 040 $ US | 3 577 330 042 $ US |
| 1996 | −38 203 596 $ US | 2 426 057 022 $ US |
| 1995 | 41 463 072 $ US | 2 143 628 110 $ US |
| 1994 | 888 384 471 $ US | 973 271 469 $ US |
| 1993 | 210 435 439 $ US | 550 370 025 $ US |
| 1992 | 2 755 603 983 $ US | 276 512 439 $ US |
| 1991 | 1 284 268 820 $ US | 73 537 638 $ US |
| 1990 | 1 806 039 008 $ US | 236 690 000 $ US |
| 1989 | −1 059 696 732 $ US | 252 100 000 $ US |
| 1988 | −483 800 487 $ US | 91 250 000 $ US |
| 1987 | 1 177 422 254 $ US | 212 320 000 $ US |
| 1986 | 242 107 762 $ US | 117 730 000 $ US |
| 1985 | 608 713 150 $ US | 106 090 000 $ US |
| 1984 | −10 000 000 $ US | 19 240 000 $ US |
| 1983 | 416 000 000 $ US | 5 640 000 $ US |
| 1982 | 439 000 000 $ US | 72 080 000 $ US |
| 1981 | 189 000 000 $ US | 91 920 000 $ US |
| 1980 | 278 000 000 $ US | 79 160 000 $ US |
| 1979 | 239 000 000 $ US | 48 570 000 $ US |
| 1978 | 8 000 000 $ US | 18 090 000 $ US |
| 1977 | 21 000 000 $ US | −36 060 000 $ US |
| 1976 | 113 000 000 $ US | −7 706 431 $ US |
| 1975 | 226 000 000 $ US | −10 326 247 $ US |
| 1974 | 202 000 000 $ US | 56 970 000 $ US |
| 1973 | −42 000 000 $ US | 37 910 000 $ US |
| 1972 | 169 000 000 $ US | 17 790 000 $ US |
| 1971 | 210 000 000 $ US | 47 660 000 $ US |
| 1970 | 94 000 000 $ US | 45 460 000 $ US |
En 2025, les entrées nettes d'investissements directs étrangers étaient de 45,8 milliards de dollars au Japon et de 40,8 milliards de dollars en Inde : 12 % de plus au Japon. En 1970, elles étaient de 94 millions de dollars au Japon et de 45,5 millions de dollars en Inde.
Les entrées nettes d'investissements directs étrangers au Japon ont été supérieures à celles de l'Inde pendant 24 des 56 années de 1970 à 2025, et inférieures pendant 32.
Japon vs Inde : dernières entrées et sorties d'investissements étrangers
|
Japon
|
Inde
|
|
|---|---|---|
| Entrées nettes | +45,8 Md $US | +40,8 Md $US |
| Entrées nettes, % du PIB | +1,0 % | +1,0 % |
| Sorties nettes | +218 Md $US | +38,2 Md $US |
| Entrées nettes, total 2016–2025 | +355 Md $US | +432 Md $US |
| Rang mondial | 10/192 | 12/192 |
Comparer les investissements directs étrangers de 2 pays au choix
Sources :
- Banque mondiale | Secteur financier (1970–2025, mis à jour en octobre 2026)
Creative Commons Attribution (CC BY) : vous pouvez copier, partager, adapter et réutiliser ce contenu, y compris à des fins commerciales, à condition de citer statistics.wiki et d’indiquer les modifications apportées. Les sources citées ci-dessus peuvent avoir leurs propres conditions de licence.