
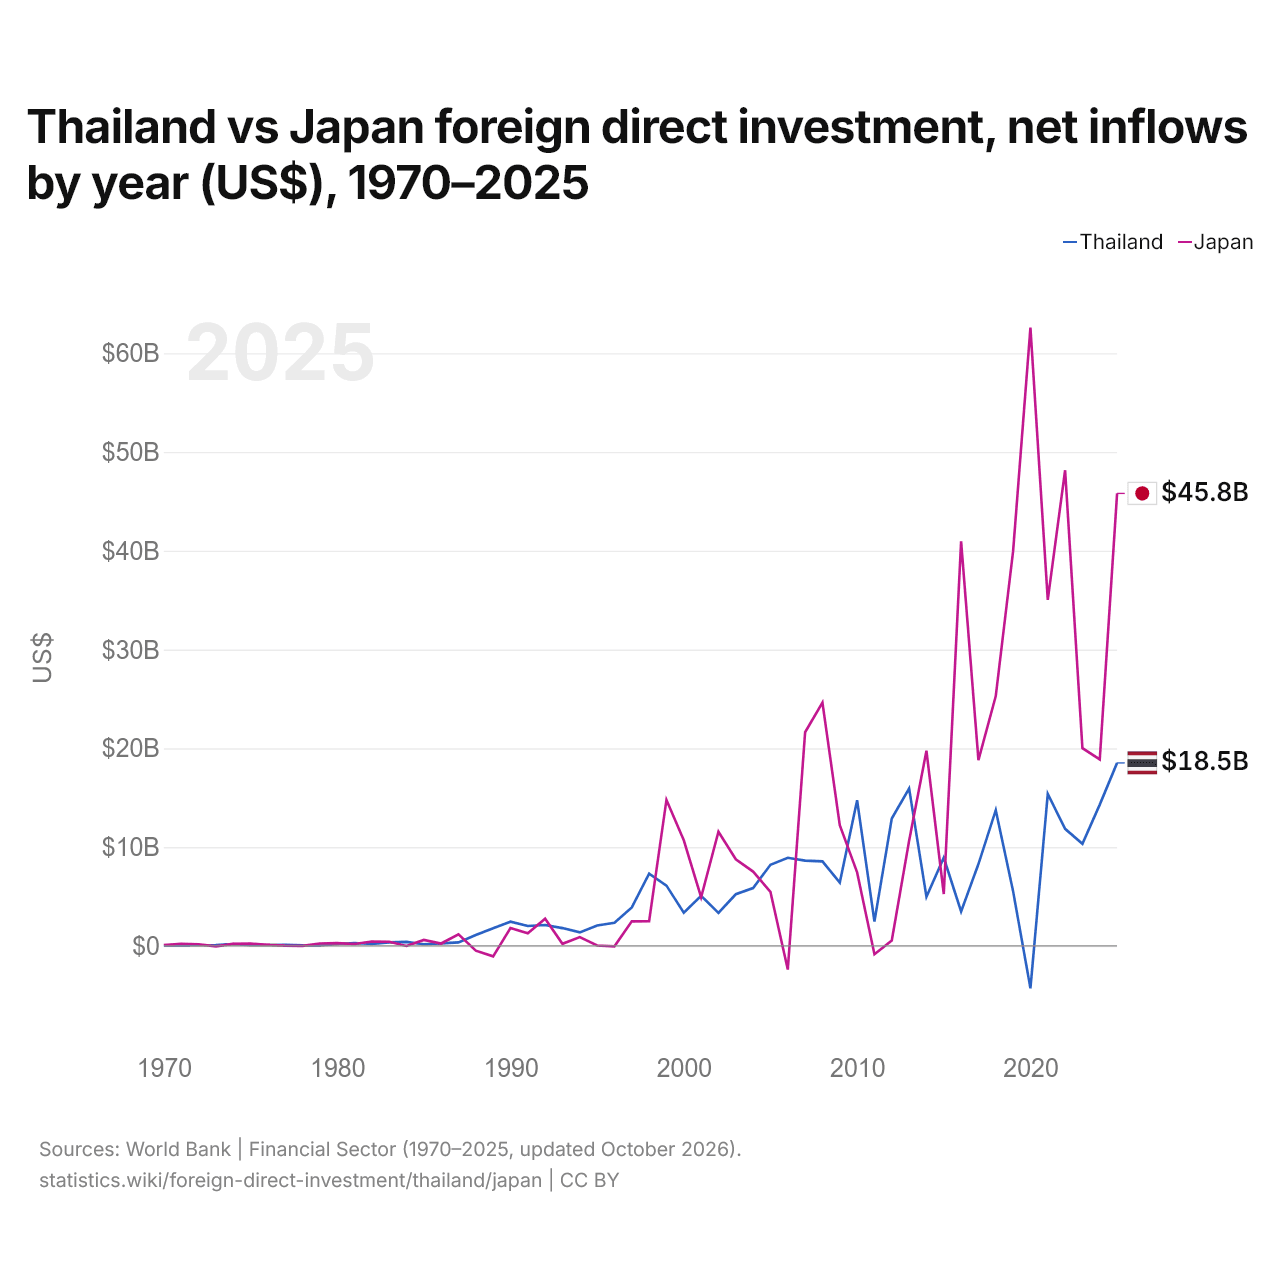
Thaïlande vs Japon : investissements directs étrangers, entrées nettes par année ($ US), 1970–2025
| Année | $ US | |
|---|---|---|
 Thaïlande |
 Japon |
|
| 2025 | 18 525 241 853 $ US | 45 805 721 095 $ US |
| 2024 | 14 302 158 846 $ US | 18 874 093 729 $ US |
| 2023 | 10 327 587 426 $ US | 20 007 989 123 $ US |
| 2022 | 11 854 822 038 $ US | 48 153 832 744 $ US |
| 2021 | 15 389 597 696 $ US | 35 027 163 876 $ US |
| 2020 | −4 293 910 677 $ US | 62 584 719 398 $ US |
| 2019 | 5 534 140 215 $ US | 39 960 544 340 $ US |
| 2018 | 13 747 219 811 $ US | 25 289 367 858 $ US |
| 2017 | 8 285 169 820 $ US | 18 802 251 208 $ US |
| 2016 | 3 486 184 390 $ US | 40 954 181 469 $ US |
| 2015 | 8 927 579 182 $ US | 5 252 218 412 $ US |
| 2014 | 4 975 455 660 $ US | 19 752 249 424 $ US |
| 2013 | 15 935 960 665 $ US | 10 648 441 636 $ US |
| 2012 | 12 899 036 063 $ US | 546 962 692 $ US |
| 2011 | 2 473 685 996 $ US | −850 717 035 $ US |
| 2010 | 14 746 672 920 $ US | 7 440 979 284 $ US |
| 2009 | 6 411 458 545 $ US | 12 226 471 579 $ US |
| 2008 | 8 561 557 725 $ US | 24 624 845 330 $ US |
| 2007 | 8 633 903 441 $ US | 21 631 204 436 $ US |
| 2006 | 8 917 470 351 $ US | −2 396 909 736 $ US |
| 2005 | 8 215 637 195 $ US | 5 459 618 343 $ US |
| 2004 | 5 860 255 943 $ US | 7 527 948 175 $ US |
| 2003 | 5 232 270 340 $ US | 8 771 535 612 $ US |
| 2002 | 3 341 612 007 $ US | 11 557 373 874 $ US |
| 2001 | 5 067 170 388 $ US | 4 926 033 619 $ US |
| 2000 | 3 365 987 583 $ US | 10 688 168 326 $ US |
| 1999 | 6 102 677 671 $ US | 14 780 510 031 $ US |
| 1998 | 7 314 804 931 $ US | 2 512 021 924 $ US |
| 1997 | 3 894 755 071 $ US | 2 486 935 040 $ US |
| 1996 | 2 335 837 475 $ US | −38 203 596 $ US |
| 1995 | 2 067 936 429 $ US | 41 463 072 $ US |
| 1994 | 1 366 440 825 $ US | 888 384 471 $ US |
| 1993 | 1 804 040 985 $ US | 210 435 439 $ US |
| 1992 | 2 113 021 867 $ US | 2 755 603 983 $ US |
| 1991 | 2 013 985 971 $ US | 1 284 268 820 $ US |
| 1990 | 2 443 549 743 $ US | 1 806 039 008 $ US |
| 1989 | 1 775 449 345 $ US | −1 059 696 732 $ US |
| 1988 | 1 105 370 110 $ US | −483 800 487 $ US |
| 1987 | 351 932 497 $ US | 1 177 422 254 $ US |
| 1986 | 262 504 154 $ US | 242 107 762 $ US |
| 1985 | 163 200 658 $ US | 608 713 150 $ US |
| 1984 | 401 019 249 $ US | −10 000 000 $ US |
| 1983 | 349 606 932 $ US | 416 000 000 $ US |
| 1982 | 190 868 602 $ US | 439 000 000 $ US |
| 1981 | 290 555 396 $ US | 189 000 000 $ US |
| 1980 | 189 859 432 $ US | 278 000 000 $ US |
| 1979 | 55 280 865 $ US | 239 000 000 $ US |
| 1978 | 55 653 209 $ US | 8 000 000 $ US |
| 1977 | 106 077 896 $ US | 21 000 000 $ US |
| 1976 | 79 117 248 $ US | 113 000 000 $ US |
| 1975 | 85 626 229 $ US | 226 000 000 $ US |
| 1974 | 188 288 646 $ US | 202 000 000 $ US |
| 1973 | 77 833 712 $ US | −42 000 000 $ US |
| 1972 | 68 610 577 $ US | 169 000 000 $ US |
| 1971 | 38 865 385 $ US | 210 000 000 $ US |
| 1970 | 42 802 885 $ US | 94 000 000 $ US |
En 2025, les entrées nettes d'investissements directs étrangers étaient de 18,5 milliards de dollars en Thaïlande et de 45,8 milliards de dollars au Japon : 2,5 fois plus au Japon. En 1970, elles étaient de 42,8 millions de dollars en Thaïlande et de 94 millions de dollars au Japon.
Les entrées nettes d'investissements directs étrangers en Thaïlande ont été supérieures à celles du Japon pendant 24 des 56 années de 1970 à 2025, et inférieures pendant 32.
Thaïlande vs Japon : dernières entrées et sorties d'investissements étrangers
|
Thaïlande
|
Japon
|
|
|---|---|---|
| Entrées nettes | +18,5 Md $US | +45,8 Md $US |
| Entrées nettes, % du PIB | +3,2 % | +1,0 % |
| Sorties nettes | +9,58 Md $US | +218 Md $US |
| Entrées nettes, total 2016–2025 | +97,2 Md $US | +355 Md $US |
| Rang mondial | 23/192 | 10/192 |
Comparer les investissements directs étrangers de 2 pays au choix
Sources :
- Banque mondiale | Secteur financier (1970–2025, mis à jour en octobre 2026)
Creative Commons Attribution (CC BY) : vous pouvez copier, partager, adapter et réutiliser ce contenu, y compris à des fins commerciales, à condition de citer statistics.wiki et d’indiquer les modifications apportées. Les sources citées ci-dessus peuvent avoir leurs propres conditions de licence.