
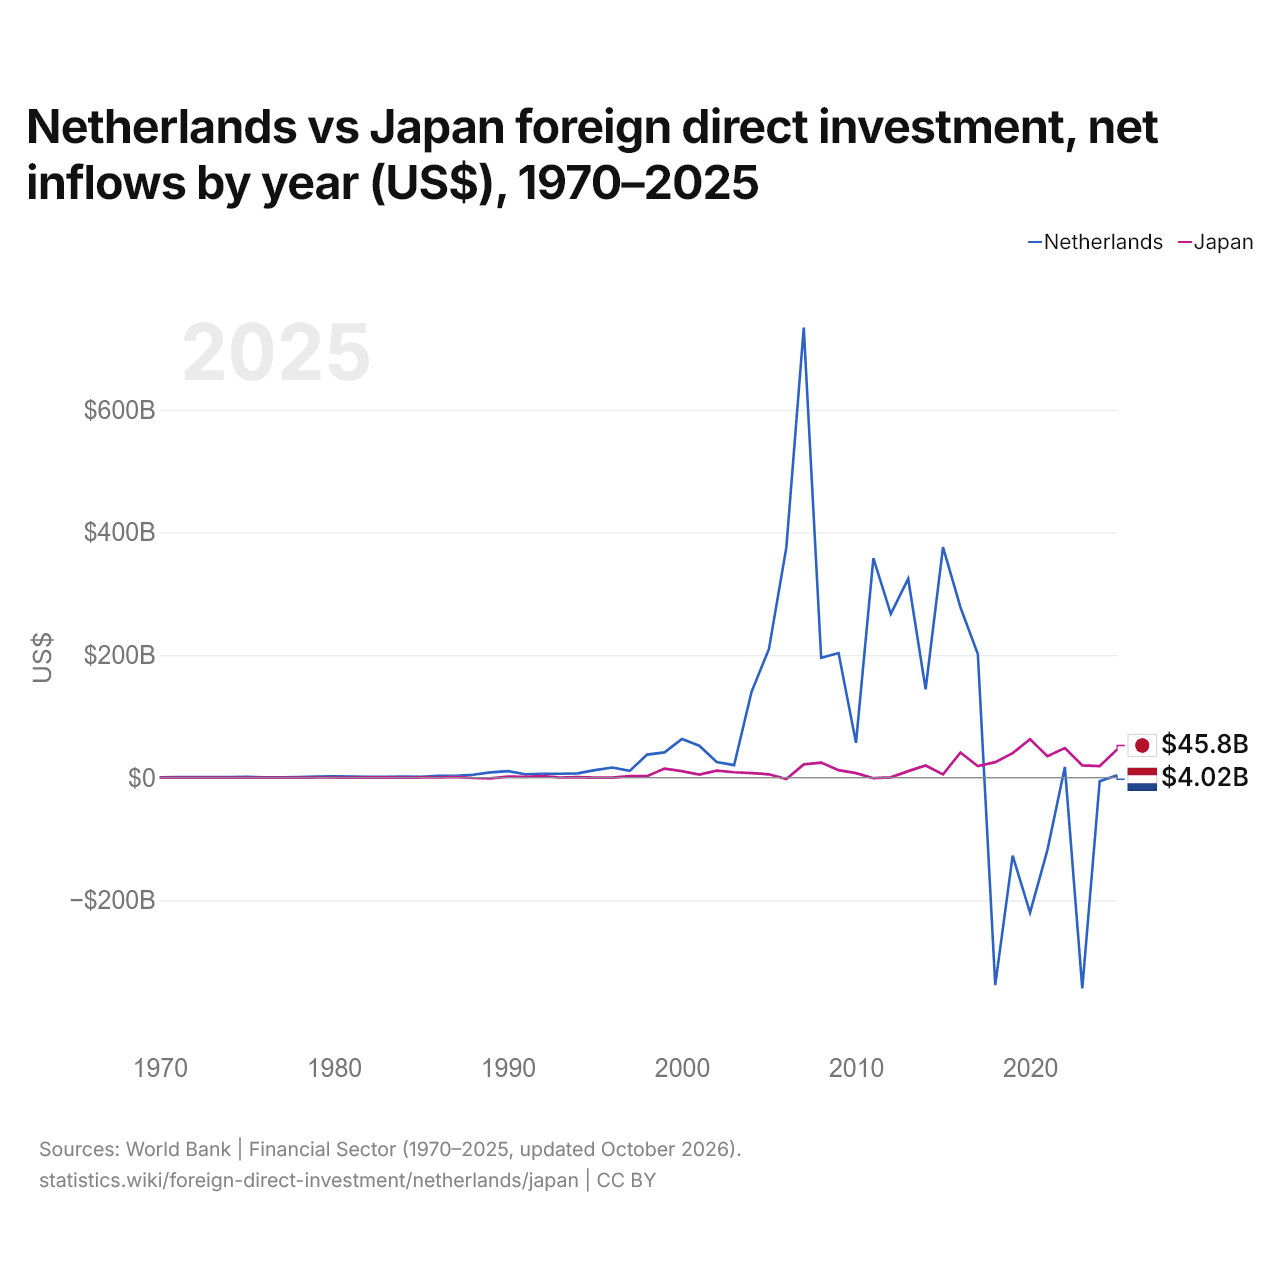
Pays-Bas vs Japon : investissements directs étrangers, entrées nettes par année ($ US), 1970–2025
| Année | $ US | |
|---|---|---|
 Pays-Bas |
 Japon |
|
| 2025 | 4 022 770 441 $ US | 45 805 721 095 $ US |
| 2024 | −5 739 934 253 $ US | 18 874 093 729 $ US |
| 2023 | −343 516 015 896 $ US | 20 007 989 123 $ US |
| 2022 | 17 477 215 207 $ US | 48 153 832 744 $ US |
| 2021 | −117 764 470 630 $ US | 35 027 163 876 $ US |
| 2020 | −220 065 061 233 $ US | 62 584 719 398 $ US |
| 2019 | −127 157 746 285 $ US | 39 960 544 340 $ US |
| 2018 | −338 389 593 704 $ US | 25 289 367 858 $ US |
| 2017 | 201 709 420 063 $ US | 18 802 251 208 $ US |
| 2016 | 277 975 761 931 $ US | 40 954 181 469 $ US |
| 2015 | 375 974 490 881 $ US | 5 252 218 412 $ US |
| 2014 | 144 156 762 347 $ US | 19 752 249 424 $ US |
| 2013 | 324 372 432 591 $ US | 10 648 441 636 $ US |
| 2012 | 267 086 617 732 $ US | 546 962 692 $ US |
| 2011 | 358 026 686 399 $ US | −850 717 035 $ US |
| 2010 | 56 931 023 183 $ US | 7 440 979 284 $ US |
| 2009 | 203 201 497 699 $ US | 12 226 471 579 $ US |
| 2008 | 195 530 109 750 $ US | 24 624 845 330 $ US |
| 2007 | 733 826 501 995 $ US | 21 631 204 436 $ US |
| 2006 | 375 506 013 118 $ US | −2 396 909 736 $ US |
| 2005 | 209 888 825 342 $ US | 5 459 618 343 $ US |
| 2004 | 139 920 688 182 $ US | 7 527 948 175 $ US |
| 2003 | 20 456 442 248 $ US | 8 771 535 612 $ US |
| 2002 | 25 485 041 348 $ US | 11 557 373 874 $ US |
| 2001 | 51 998 915 898 $ US | 4 926 033 619 $ US |
| 2000 | 63 109 732 335 $ US | 10 688 168 326 $ US |
| 1999 | 41 161 898 490 $ US | 14 780 510 031 $ US |
| 1998 | 37 618 898 706 $ US | 2 512 021 924 $ US |
| 1997 | 11 033 361 090 $ US | 2 486 935 040 $ US |
| 1996 | 16 604 370 594 $ US | −38 203 596 $ US |
| 1995 | 12 206 170 579 $ US | 41 463 072 $ US |
| 1994 | 7 126 515 355 $ US | 888 384 471 $ US |
| 1993 | 6 380 304 064 $ US | 210 435 439 $ US |
| 1992 | 6 186 517 513 $ US | 2 755 603 983 $ US |
| 1991 | 5 623 819 475 $ US | 1 284 268 820 $ US |
| 1990 | 10 675 649 733 $ US | 1 806 039 008 $ US |
| 1989 | 8 559 308 808 $ US | −1 059 696 732 $ US |
| 1988 | 4 781 352 996 $ US | −483 800 487 $ US |
| 1987 | 3 029 037 167 $ US | 1 177 422 254 $ US |
| 1986 | 3 129 068 298 $ US | 242 107 762 $ US |
| 1985 | 1 504 626 364 $ US | 608 713 150 $ US |
| 1984 | 1 716 938 277 $ US | −10 000 000 $ US |
| 1983 | 1 357 995 934 $ US | 416 000 000 $ US |
| 1982 | 1 227 497 018 $ US | 439 000 000 $ US |
| 1981 | 1 799 058 373 $ US | 189 000 000 $ US |
| 1980 | 2 278 377 890 $ US | 278 000 000 $ US |
| 1979 | 1 715 155 179 $ US | 239 000 000 $ US |
| 1978 | 1 082 145 423 $ US | 8 000 000 $ US |
| 1977 | 605 297 449 $ US | 21 000 000 $ US |
| 1976 | 581 098 299 $ US | 113 000 000 $ US |
| 1975 | 1 232 377 357 $ US | 226 000 000 $ US |
| 1974 | 1 103 114 454 $ US | 202 000 000 $ US |
| 1973 | 1 118 995 448 $ US | −42 000 000 $ US |
| 1972 | 754 553 458 $ US | 169 000 000 $ US |
| 1971 | 752 897 735 $ US | 210 000 000 $ US |
| 1970 | 632 596 685 $ US | 94 000 000 $ US |
En 2025, les entrées nettes d'investissements directs étrangers étaient de 4,02 milliards de dollars aux Pays-Bas et de 45,8 milliards de dollars au Japon : 11 fois plus au Japon. En 1970, elles étaient de 633 millions de dollars aux Pays-Bas et de 94 millions de dollars au Japon.
Les entrées nettes d'investissements directs étrangers aux Pays-Bas ont été supérieures à celles du Japon pendant 48 des 56 années de 1970 à 2025, et inférieures pendant 8.
Pays-Bas vs Japon : dernières entrées et sorties d'investissements étrangers
|
Pays-Bas
|
Japon
|
|
|---|---|---|
| Entrées nettes | +4,02 Md $US | +45,8 Md $US |
| Entrées nettes, % du PIB | +0,3 % | +1,0 % |
| Sorties nettes | +121 Md $US | +218 Md $US |
| Entrées nettes, total 2016–2025 | −651 Md $US | +355 Md $US |
| Rang mondial | 50/192 | 10/192 |
Comparer les investissements directs étrangers de 2 pays au choix
Sources :
- Banque mondiale | Secteur financier (1970–2025, mis à jour en octobre 2026)
Creative Commons Attribution (CC BY) : vous pouvez copier, partager, adapter et réutiliser ce contenu, y compris à des fins commerciales, à condition de citer statistics.wiki et d’indiquer les modifications apportées. Les sources citées ci-dessus peuvent avoir leurs propres conditions de licence.