
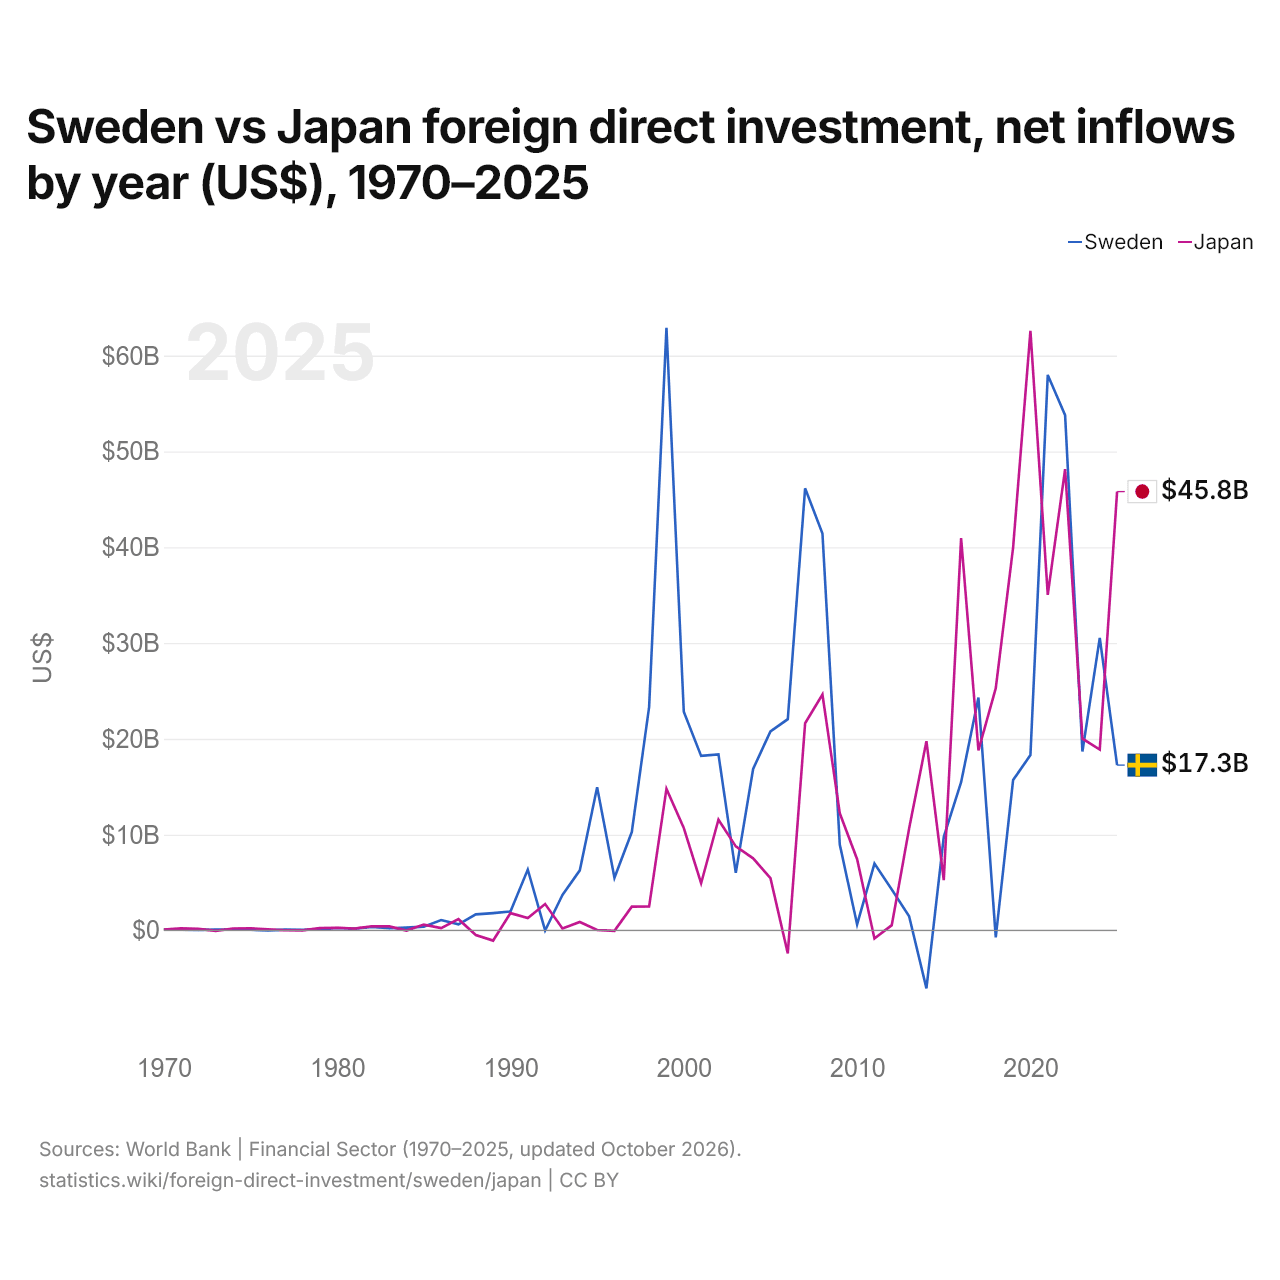
Suède vs Japon : investissements directs étrangers, entrées nettes par année ($ US), 1970–2025
| Année | $ US | |
|---|---|---|
 Suède |
 Japon |
|
| 2025 | 17 258 924 126 $ US | 45 805 721 095 $ US |
| 2024 | 30 533 470 372 $ US | 18 874 093 729 $ US |
| 2023 | 18 673 173 171 $ US | 20 007 989 123 $ US |
| 2022 | 53 782 285 500 $ US | 48 153 832 744 $ US |
| 2021 | 57 981 119 710 $ US | 35 027 163 876 $ US |
| 2020 | 18 307 766 875 $ US | 62 584 719 398 $ US |
| 2019 | 15 692 851 350 $ US | 39 960 544 340 $ US |
| 2018 | −714 153 381 $ US | 25 289 367 858 $ US |
| 2017 | 24 305 209 925 $ US | 18 802 251 208 $ US |
| 2016 | 15 470 455 706 $ US | 40 954 181 469 $ US |
| 2015 | 9 777 569 491 $ US | 5 252 218 412 $ US |
| 2014 | −6 039 792 920 $ US | 19 752 249 424 $ US |
| 2013 | 1 487 752 726 $ US | 10 648 441 636 $ US |
| 2012 | 4 273 531 542 $ US | 546 962 692 $ US |
| 2011 | 6 979 353 755 $ US | −850 717 035 $ US |
| 2010 | 625 102 142 $ US | 7 440 979 284 $ US |
| 2009 | 8 960 871 621 $ US | 12 226 471 579 $ US |
| 2008 | 41 436 553 996 $ US | 24 624 845 330 $ US |
| 2007 | 46 143 507 533 $ US | 21 631 204 436 $ US |
| 2006 | 22 052 656 379 $ US | −2 396 909 736 $ US |
| 2005 | 20 782 686 616 $ US | 5 459 618 343 $ US |
| 2004 | 16 854 649 894 $ US | 7 527 948 175 $ US |
| 2003 | 6 007 683 416 $ US | 8 771 535 612 $ US |
| 2002 | 18 381 645 408 $ US | 11 557 373 874 $ US |
| 2001 | 18 217 810 086 $ US | 4 926 033 619 $ US |
| 2000 | 22 817 836 821 $ US | 10 688 168 326 $ US |
| 1999 | 62 910 430 888 $ US | 14 780 510 031 $ US |
| 1998 | 23 334 866 535 $ US | 2 512 021 924 $ US |
| 1997 | 10 271 066 269 $ US | 2 486 935 040 $ US |
| 1996 | 5 491 883 748 $ US | −38 203 596 $ US |
| 1995 | 14 939 375 567 $ US | 41 463 072 $ US |
| 1994 | 6 268 780 978 $ US | 888 384 471 $ US |
| 1993 | 3 704 921 362 $ US | 210 435 439 $ US |
| 1992 | −5 418 690 $ US | 2 755 603 983 $ US |
| 1991 | 6 350 883 200 $ US | 1 284 268 820 $ US |
| 1990 | 1 982 424 728 $ US | 1 806 039 008 $ US |
| 1989 | 1 812 004 571 $ US | −1 059 696 732 $ US |
| 1988 | 1 673 425 168 $ US | −483 800 487 $ US |
| 1987 | 639 212 993 $ US | 1 177 422 254 $ US |
| 1986 | 1 082 656 171 $ US | 242 107 762 $ US |
| 1985 | 392 953 912 $ US | 608 713 150 $ US |
| 1984 | 290 015 353 $ US | −10 000 000 $ US |
| 1983 | 225 698 176 $ US | 416 000 000 $ US |
| 1982 | 355 014 409 $ US | 439 000 000 $ US |
| 1981 | 181 117 389 $ US | 189 000 000 $ US |
| 1980 | 250 911 513 $ US | 278 000 000 $ US |
| 1979 | 112 469 610 $ US | 239 000 000 $ US |
| 1978 | 69 712 037 $ US | 8 000 000 $ US |
| 1977 | 81 453 707 $ US | 21 000 000 $ US |
| 1976 | 4 864 300 $ US | 113 000 000 $ US |
| 1975 | 80 215 155 $ US | 226 000 000 $ US |
| 1974 | 76 586 495 $ US | 202 000 000 $ US |
| 1973 | 83 963 593 $ US | −42 000 000 $ US |
| 1972 | 65 306 130 $ US | 169 000 000 $ US |
| 1971 | 84 100 267 $ US | 210 000 000 $ US |
| 1970 | 108 250 003 $ US | 94 000 000 $ US |
En 2025, les entrées nettes d'investissements directs étrangers étaient de 17,3 milliards de dollars en Suède et de 45,8 milliards de dollars au Japon : 2,7 fois plus au Japon. En 1970, elles étaient de 108 millions de dollars en Suède et de 94 millions de dollars au Japon.
Les entrées nettes d'investissements directs étrangers en Suède ont été supérieures à celles du Japon pendant 32 des 56 années de 1970 à 2025, et inférieures pendant 24.
Suède vs Japon : dernières entrées et sorties d'investissements étrangers
|
Suède
|
Japon
|
|
|---|---|---|
| Entrées nettes | +17,3 Md $US | +45,8 Md $US |
| Entrées nettes, % du PIB | +2,6 % | +1,0 % |
| Sorties nettes | +7,36 Md $US | +218 Md $US |
| Entrées nettes, total 2016–2025 | +251 Md $US | +355 Md $US |
| Rang mondial | 24/192 | 10/192 |
Comparer les investissements directs étrangers de 2 pays au choix
Sources :
- Banque mondiale | Secteur financier (1970–2025, mis à jour en octobre 2026)
Creative Commons Attribution (CC BY) : vous pouvez copier, partager, adapter et réutiliser ce contenu, y compris à des fins commerciales, à condition de citer statistics.wiki et d’indiquer les modifications apportées. Les sources citées ci-dessus peuvent avoir leurs propres conditions de licence.