
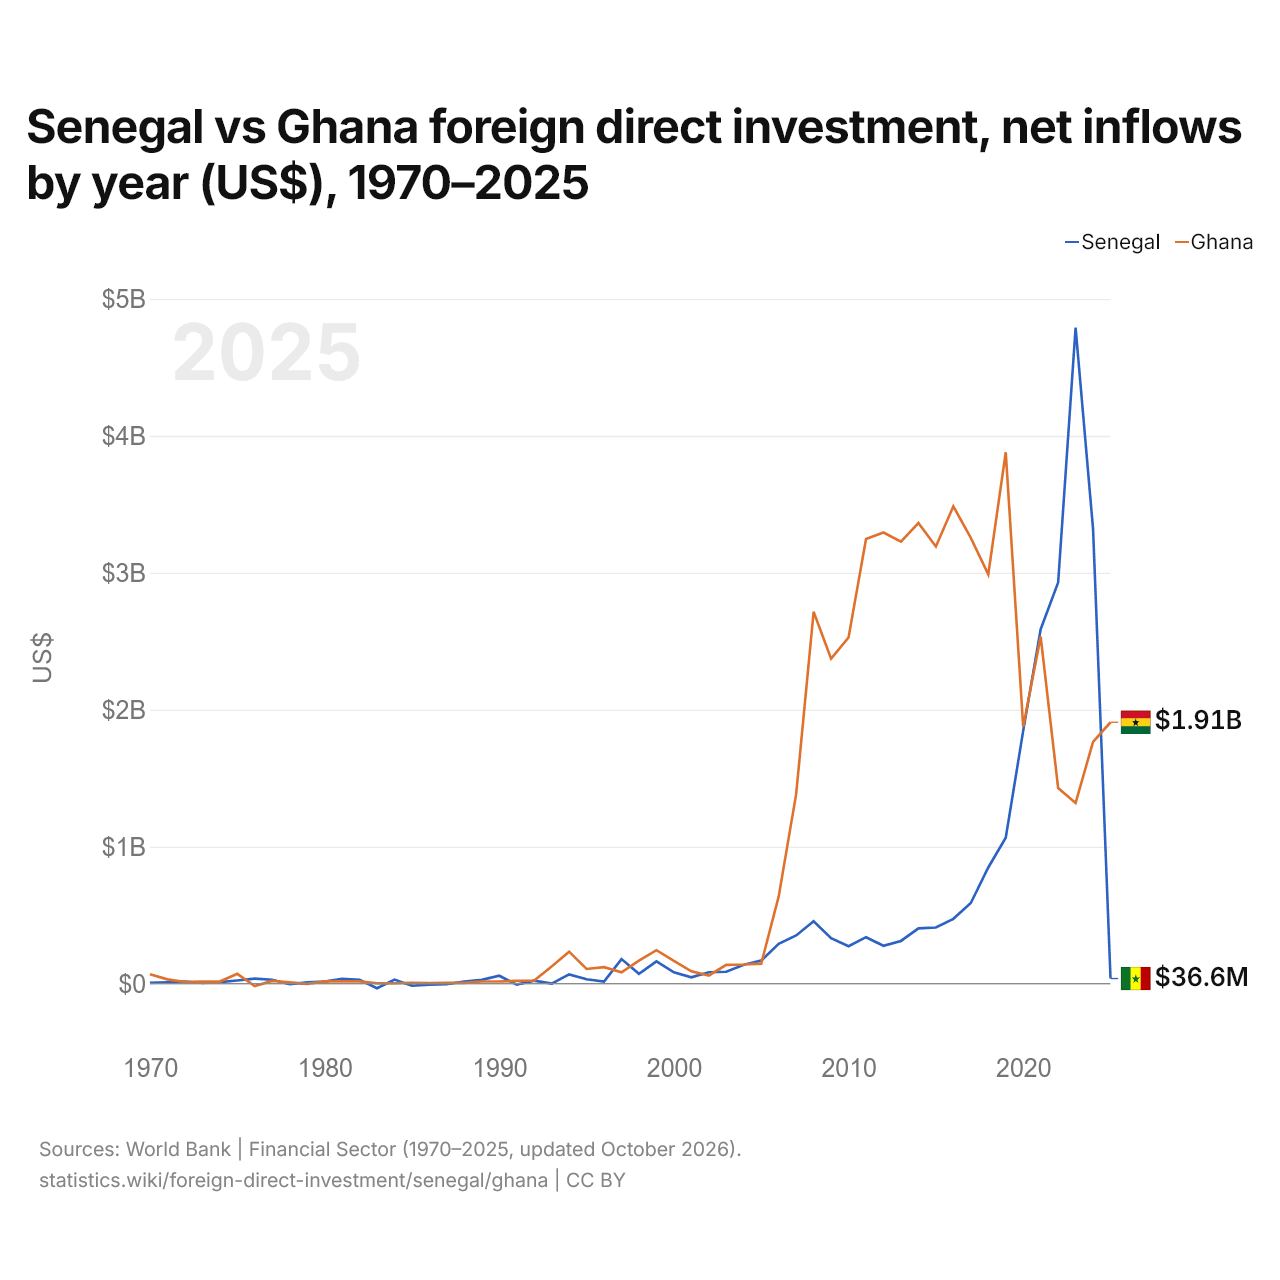
Sénégal vs Ghana : investissements directs étrangers, entrées nettes par année ($ US), 1970–2025
| Année | $ US | |
|---|---|---|
 Sénégal |
 Ghana |
|
| 2025 | 36 576 601 $ US | 1 908 244 011 $ US |
| 2024 | 3 318 671 430 $ US | 1 765 552 580 $ US |
| 2023 | 4 789 996 739 $ US | 1 319 315 615 $ US |
| 2022 | 2 928 675 555 $ US | 1 428 411 737 $ US |
| 2021 | 2 588 127 208 $ US | 2 533 586 462 $ US |
| 2020 | 1 845 665 273 $ US | 1 875 782 953 $ US |
| 2019 | 1 065 461 344 $ US | 3 879 831 470 $ US |
| 2018 | 847 841 575 $ US | 2 989 035 000 $ US |
| 2017 | 588 292 998 $ US | 3 254 990 000 $ US |
| 2016 | 472 409 800 $ US | 3 485 333 369 $ US |
| 2015 | 409 166 126 $ US | 3 192 320 531 $ US |
| 2014 | 403 098 056 $ US | 3 363 389 444 $ US |
| 2013 | 311 366 769 $ US | 3 227 000 000 $ US |
| 2012 | 276 159 533 $ US | 3 294 520 000 $ US |
| 2011 | 338 661 996 $ US | 3 247 588 000 $ US |
| 2010 | 272 092 888 $ US | 2 527 350 000 $ US |
| 2009 | 331 473 910 $ US | 2 372 540 000 $ US |
| 2008 | 455 739 868 $ US | 2 714 916 344 $ US |
| 2007 | 351 458 732 $ US | 1 383 177 930 $ US |
| 2006 | 289 840 300 $ US | 636 010 000 $ US |
| 2005 | 167 944 231 $ US | 144 970 000 $ US |
| 2004 | 137 583 477 $ US | 139 270 000 $ US |
| 2003 | 86 499 780 $ US | 136 751 000 $ US |
| 2002 | 82 692 672 $ US | 58 930 000 $ US |
| 2001 | 45 083 430 $ US | 89 320 000 $ US |
| 2000 | 81 643 690 $ US | 165 900 000 $ US |
| 1999 | 161 686 936 $ US | 243 700 000 $ US |
| 1998 | 71 105 812 $ US | 167 400 000 $ US |
| 1997 | 178 810 136 $ US | 81 800 000 $ US |
| 1996 | 13 955 559 $ US | 120 000 000 $ US |
| 1995 | 31 673 945 $ US | 106 500 000 $ US |
| 1994 | 66 876 236 $ US | 233 000 000 $ US |
| 1993 | −812 254 $ US | 125 000 000 $ US |
| 1992 | 21 383 360 $ US | 22 500 000 $ US |
| 1991 | −7 550 329 $ US | 20 000 000 $ US |
| 1990 | 56 893 145 $ US | 14 800 000 $ US |
| 1989 | 26 801 811 $ US | 15 000 000 $ US |
| 1988 | 14 940 496 $ US | 5 000 000 $ US |
| 1987 | −3 959 585 $ US | 4 700 000 $ US |
| 1986 | −8 431 852 $ US | 4 300 000 $ US |
| 1985 | −15 803 662 $ US | 5 600 000 $ US |
| 1984 | 29 087 553 $ US | 2 000 000 $ US |
| 1983 | −34 692 150 $ US | 2 400 000 $ US |
| 1982 | 28 057 896 $ US | 16 300 000 $ US |
| 1981 | 34 372 171 $ US | 16 263 752 $ US |
| 1980 | 14 483 181 $ US | 15 600 000 $ US |
| 1979 | 8 931 860 $ US | −2 800 000 $ US |
| 1978 | −5 007 625 $ US | 9 696 237 $ US |
| 1977 | 27 963 240 $ US | 19 217 479 $ US |
| 1976 | 35 865 170 $ US | −18 260 970 $ US |
| 1975 | 22 537 141 $ US | 70 869 955 $ US |
| 1974 | 10 261 538 $ US | 14 270 000 $ US |
| 1973 | 4 900 000 $ US | 14 400 000 $ US |
| 1972 | 15 200 000 $ US | 11 500 000 $ US |
| 1971 | 9 800 000 $ US | 30 600 000 $ US |
| 1970 | 5 000 000 $ US | 67 800 000 $ US |
En 2025, les entrées nettes d'investissements directs étrangers étaient de 36,6 millions de dollars au Sénégal et de 1,91 milliard de dollars au Ghana : 52 fois plus au Ghana. En 1970, elles étaient de 5 millions de dollars au Sénégal et de 67,8 millions de dollars au Ghana.
Les entrées nettes d'investissements directs étrangers au Sénégal ont été supérieures à celles du Ghana pendant 17 des 56 années de 1970 à 2025, et inférieures pendant 39.
Sénégal vs Ghana : dernières entrées et sorties d'investissements étrangers
|
Sénégal
|
Ghana
|
|
|---|---|---|
| Entrées nettes | +36,6 M $US | +1,91 Md $US |
| Entrées nettes, % du PIB | +0,1 % | +1,7 % |
| Sorties nettes | +638 k $US | +38,8 M $US |
| Entrées nettes, total 2016–2025 | +18,5 Md $US | +24,4 Md $US |
| Rang mondial | 157/192 | 68/192 |
Comparer les investissements directs étrangers de 2 pays au choix
Sources :
- Banque mondiale | Secteur financier (1970–2025, mis à jour en octobre 2026)
Creative Commons Attribution (CC BY) : vous pouvez copier, partager, adapter et réutiliser ce contenu, y compris à des fins commerciales, à condition de citer statistics.wiki et d’indiquer les modifications apportées. Les sources citées ci-dessus peuvent avoir leurs propres conditions de licence.