
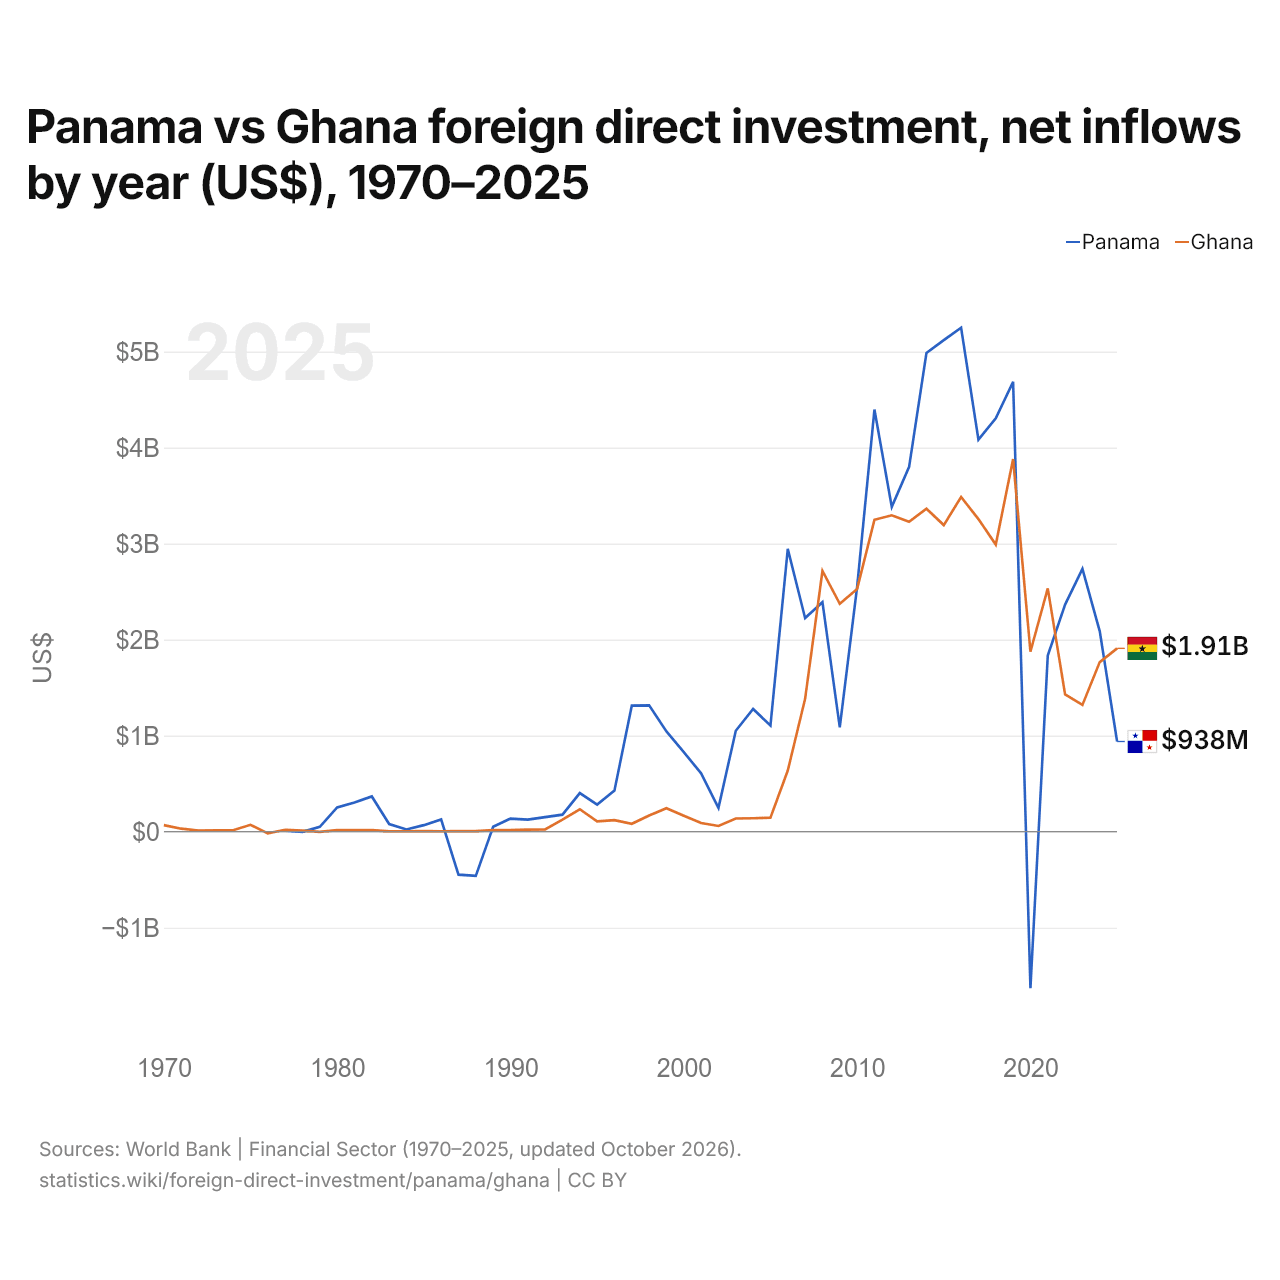
Panama vs Ghana : investissements directs étrangers, entrées nettes par année ($ US), 1970–2025
| Année | $ US | |
|---|---|---|
 Panama |
 Ghana |
|
| 2025 | 938 465 229 $ US | 1 908 244 011 $ US |
| 2024 | 2 085 774 954 $ US | 1 765 552 580 $ US |
| 2023 | 2 735 497 267 $ US | 1 319 315 615 $ US |
| 2022 | 2 365 160 115 $ US | 1 428 411 737 $ US |
| 2021 | 1 833 062 357 $ US | 2 533 586 462 $ US |
| 2020 | −1 631 797 634 $ US | 1 875 782 953 $ US |
| 2019 | 4 684 615 504 $ US | 3 879 831 470 $ US |
| 2018 | 4 304 245 891 $ US | 2 989 035 000 $ US |
| 2017 | 4 082 062 469 $ US | 3 254 990 000 $ US |
| 2016 | 5 248 354 450 $ US | 3 485 333 369 $ US |
| 2015 | 5 119 300 000 $ US | 3 192 320 531 $ US |
| 2014 | 4 984 400 000 $ US | 3 363 389 444 $ US |
| 2013 | 3 799 000 000 $ US | 3 227 000 000 $ US |
| 2012 | 3 381 900 000 $ US | 3 294 520 000 $ US |
| 2011 | 4 395 600 000 $ US | 3 247 588 000 $ US |
| 2010 | 2 549 100 000 $ US | 2 527 350 000 $ US |
| 2009 | 1 085 500 000 $ US | 2 372 540 000 $ US |
| 2008 | 2 390 000 000 $ US | 2 714 916 344 $ US |
| 2007 | 2 224 000 000 $ US | 1 383 177 930 $ US |
| 2006 | 2 944 300 000 $ US | 636 010 000 $ US |
| 2005 | 1 104 400 000 $ US | 144 970 000 $ US |
| 2004 | 1 277 900 000 $ US | 139 270 000 $ US |
| 2003 | 1 050 600 000 $ US | 136 751 000 $ US |
| 2002 | 247 100 000 $ US | 58 930 000 $ US |
| 2001 | 606 800 000 $ US | 89 320 000 $ US |
| 2000 | 827 800 000 $ US | 165 900 000 $ US |
| 1999 | 1 043 500 000 $ US | 243 700 000 $ US |
| 1998 | 1 315 200 000 $ US | 167 400 000 $ US |
| 1997 | 1 312 200 000 $ US | 81 800 000 $ US |
| 1996 | 428 300 000 $ US | 120 000 000 $ US |
| 1995 | 281 300 000 $ US | 106 500 000 $ US |
| 1994 | 401 500 000 $ US | 233 000 000 $ US |
| 1993 | 177 000 000 $ US | 125 000 000 $ US |
| 1992 | 150 500 000 $ US | 22 500 000 $ US |
| 1991 | 124 700 000 $ US | 20 000 000 $ US |
| 1990 | 135 500 000 $ US | 14 800 000 $ US |
| 1989 | 51 500 000 $ US | 15 000 000 $ US |
| 1988 | −460 500 000 $ US | 5 000 000 $ US |
| 1987 | −447 900 000 $ US | 4 700 000 $ US |
| 1986 | 126 100 000 $ US | 4 300 000 $ US |
| 1985 | 67 300 000 $ US | 5 600 000 $ US |
| 1984 | 22 200 000 $ US | 2 000 000 $ US |
| 1983 | 79 400 000 $ US | 2 400 000 $ US |
| 1982 | 366 600 000 $ US | 16 300 000 $ US |
| 1981 | 303 200 000 $ US | 16 263 752 $ US |
| 1980 | 252 300 000 $ US | 15 600 000 $ US |
| 1979 | 49 800 000 $ US | −2 800 000 $ US |
| 1978 | −2 500 000 $ US | 9 696 237 $ US |
| 1977 | 10 900 000 $ US | 19 217 479 $ US |
| 1976 | - | −18 260 970 $ US |
| 1975 | - | 70 869 955 $ US |
| 1974 | - | 14 270 000 $ US |
| 1973 | - | 14 400 000 $ US |
| 1972 | - | 11 500 000 $ US |
| 1971 | - | 30 600 000 $ US |
| 1970 | - | 67 800 000 $ US |
En 2025, les entrées nettes d'investissements directs étrangers étaient de 938 millions de dollars au Panama et de 1,91 milliard de dollars au Ghana : 2,0 fois plus au Ghana. En 1977, elles étaient de 10,9 millions de dollars au Panama et de 19,2 millions de dollars au Ghana.
Les entrées nettes d'investissements directs étrangers au Panama ont été supérieures à celles du Ghana pendant 40 des 49 années de 1977 à 2025, et inférieures pendant 9.
Panama vs Ghana : dernières entrées et sorties d'investissements étrangers
|
Panama
|
Ghana
|
|
|---|---|---|
| Entrées nettes | +938 M $US | +1,91 Md $US |
| Entrées nettes, % du PIB | +1,0 % | +1,7 % |
| Sorties nettes | −871 M $US | +38,8 M $US |
| Entrées nettes, total 2016–2025 | +26,6 Md $US | +24,4 Md $US |
| Rang mondial | 95/192 | 68/192 |
Comparer les investissements directs étrangers de 2 pays au choix
Sources :
- Banque mondiale | Secteur financier (1970–2025, mis à jour en octobre 2026)
Creative Commons Attribution (CC BY) : vous pouvez copier, partager, adapter et réutiliser ce contenu, y compris à des fins commerciales, à condition de citer statistics.wiki et d’indiquer les modifications apportées. Les sources citées ci-dessus peuvent avoir leurs propres conditions de licence.