
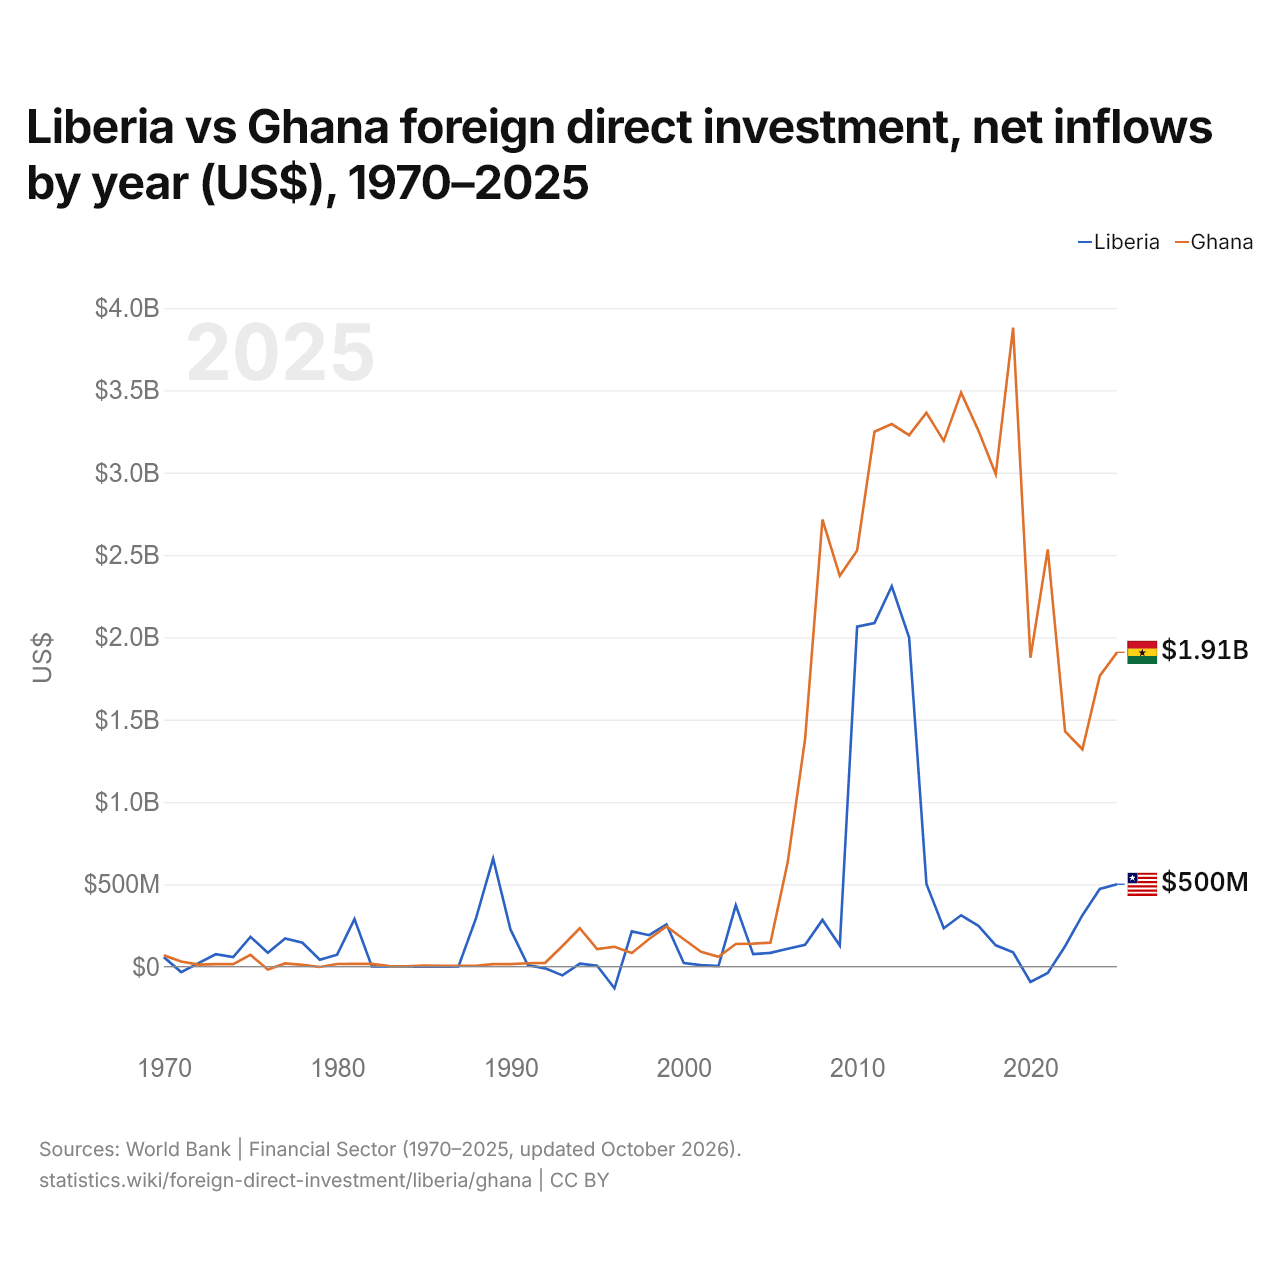
Liberia vs Ghana : investissements directs étrangers, entrées nettes par année ($ US), 1970–2025
| Année | $ US | |
|---|---|---|
 Liberia |
 Ghana |
|
| 2025 | 500 000 000 $ US | 1 908 244 011 $ US |
| 2024 | 471 538 317 $ US | 1 765 552 580 $ US |
| 2023 | 312 281 352 $ US | 1 319 315 615 $ US |
| 2022 | 123 765 394 $ US | 1 428 411 737 $ US |
| 2021 | −39 290 947 $ US | 2 533 586 462 $ US |
| 2020 | −94 014 462 $ US | 1 875 782 953 $ US |
| 2019 | 86 681 700 $ US | 3 879 831 470 $ US |
| 2018 | 129 129 755 $ US | 2 989 035 000 $ US |
| 2017 | 247 842 983 $ US | 3 254 990 000 $ US |
| 2016 | 311 699 760 $ US | 3 485 333 369 $ US |
| 2015 | 232 679 832 $ US | 3 192 320 531 $ US |
| 2014 | 501 870 829 $ US | 3 363 389 444 $ US |
| 2013 | 1 998 675 366 $ US | 3 227 000 000 $ US |
| 2012 | 2 309 981 241 $ US | 3 294 520 000 $ US |
| 2011 | 2 086 006 933 $ US | 3 247 588 000 $ US |
| 2010 | 2 064 680 994 $ US | 2 527 350 000 $ US |
| 2009 | 127 803 425 $ US | 2 372 540 000 $ US |
| 2008 | 283 536 077 $ US | 2 714 916 344 $ US |
| 2007 | 131 637 662 $ US | 1 383 177 930 $ US |
| 2006 | 107 856 672 $ US | 636 010 000 $ US |
| 2005 | 82 802 111 $ US | 144 970 000 $ US |
| 2004 | 75 351 732 $ US | 139 270 000 $ US |
| 2003 | 372 220 000 $ US | 136 751 000 $ US |
| 2002 | 2 800 000 $ US | 58 930 000 $ US |
| 2001 | 8 300 000 $ US | 89 320 000 $ US |
| 2000 | 20 800 000 $ US | 165 900 000 $ US |
| 1999 | 256 260 000 $ US | 243 700 000 $ US |
| 1998 | 190 310 000 $ US | 167 400 000 $ US |
| 1997 | 213 820 000 $ US | 81 800 000 $ US |
| 1996 | −132 130 000 $ US | 120 000 000 $ US |
| 1995 | 4 600 000 $ US | 106 500 000 $ US |
| 1994 | 17 380 000 $ US | 233 000 000 $ US |
| 1993 | −53 620 000 $ US | 125 000 000 $ US |
| 1992 | −10 850 000 $ US | 22 500 000 $ US |
| 1991 | 8 410 000 $ US | 20 000 000 $ US |
| 1990 | 225 240 000 $ US | 14 800 000 $ US |
| 1989 | 656 040 000 $ US | 15 000 000 $ US |
| 1988 | 290 150 000 $ US | 5 000 000 $ US |
| 1987 | 829 049 $ US | 4 700 000 $ US |
| 1986 | −355 307 $ US | 4 300 000 $ US |
| 1985 | −348 847 $ US | 5 600 000 $ US |
| 1984 | 779 522 $ US | 2 000 000 $ US |
| 1983 | 1 057 307 $ US | 2 400 000 $ US |
| 1982 | 749 375 $ US | 16 300 000 $ US |
| 1981 | 287 950 000 $ US | 16 263 752 $ US |
| 1980 | 71 920 000 $ US | 15 600 000 $ US |
| 1979 | 41 210 000 $ US | −2 800 000 $ US |
| 1978 | 144 690 000 $ US | 9 696 237 $ US |
| 1977 | 170 450 000 $ US | 19 217 479 $ US |
| 1976 | 83 170 000 $ US | −18 260 970 $ US |
| 1975 | 180 410 000 $ US | 70 869 955 $ US |
| 1974 | 57 710 000 $ US | 14 270 000 $ US |
| 1973 | 74 840 000 $ US | 14 400 000 $ US |
| 1972 | 20 650 000 $ US | 11 500 000 $ US |
| 1971 | −33 960 000 $ US | 30 600 000 $ US |
| 1970 | 57 140 000 $ US | 67 800 000 $ US |
En 2025, les entrées nettes d'investissements directs étrangers étaient de 500 millions de dollars au Liberia et de 1,91 milliard de dollars au Ghana : 3,8 fois plus au Ghana. En 1970, elles étaient de 57,1 millions de dollars au Liberia et de 67,8 millions de dollars au Ghana.
Les entrées nettes d'investissements directs étrangers au Liberia ont été supérieures à celles du Ghana pendant 17 des 56 années de 1970 à 2025, et inférieures pendant 39.
Liberia vs Ghana : dernières entrées et sorties d'investissements étrangers
|
Liberia
|
Ghana
|
|
|---|---|---|
| Entrées nettes | +500 M $US | +1,91 Md $US |
| Entrées nettes, % du PIB | +9,5 % | +1,7 % |
| Sorties nettes | +86,0 M $US | +38,8 M $US |
| Entrées nettes, total 2016–2025 | +2,05 Md $US | +24,4 Md $US |
| Rang mondial | 116/192 | 68/192 |
Comparer les investissements directs étrangers de 2 pays au choix
Sources :
- Banque mondiale | Secteur financier (1970–2025, mis à jour en octobre 2026)
Creative Commons Attribution (CC BY) : vous pouvez copier, partager, adapter et réutiliser ce contenu, y compris à des fins commerciales, à condition de citer statistics.wiki et d’indiquer les modifications apportées. Les sources citées ci-dessus peuvent avoir leurs propres conditions de licence.