
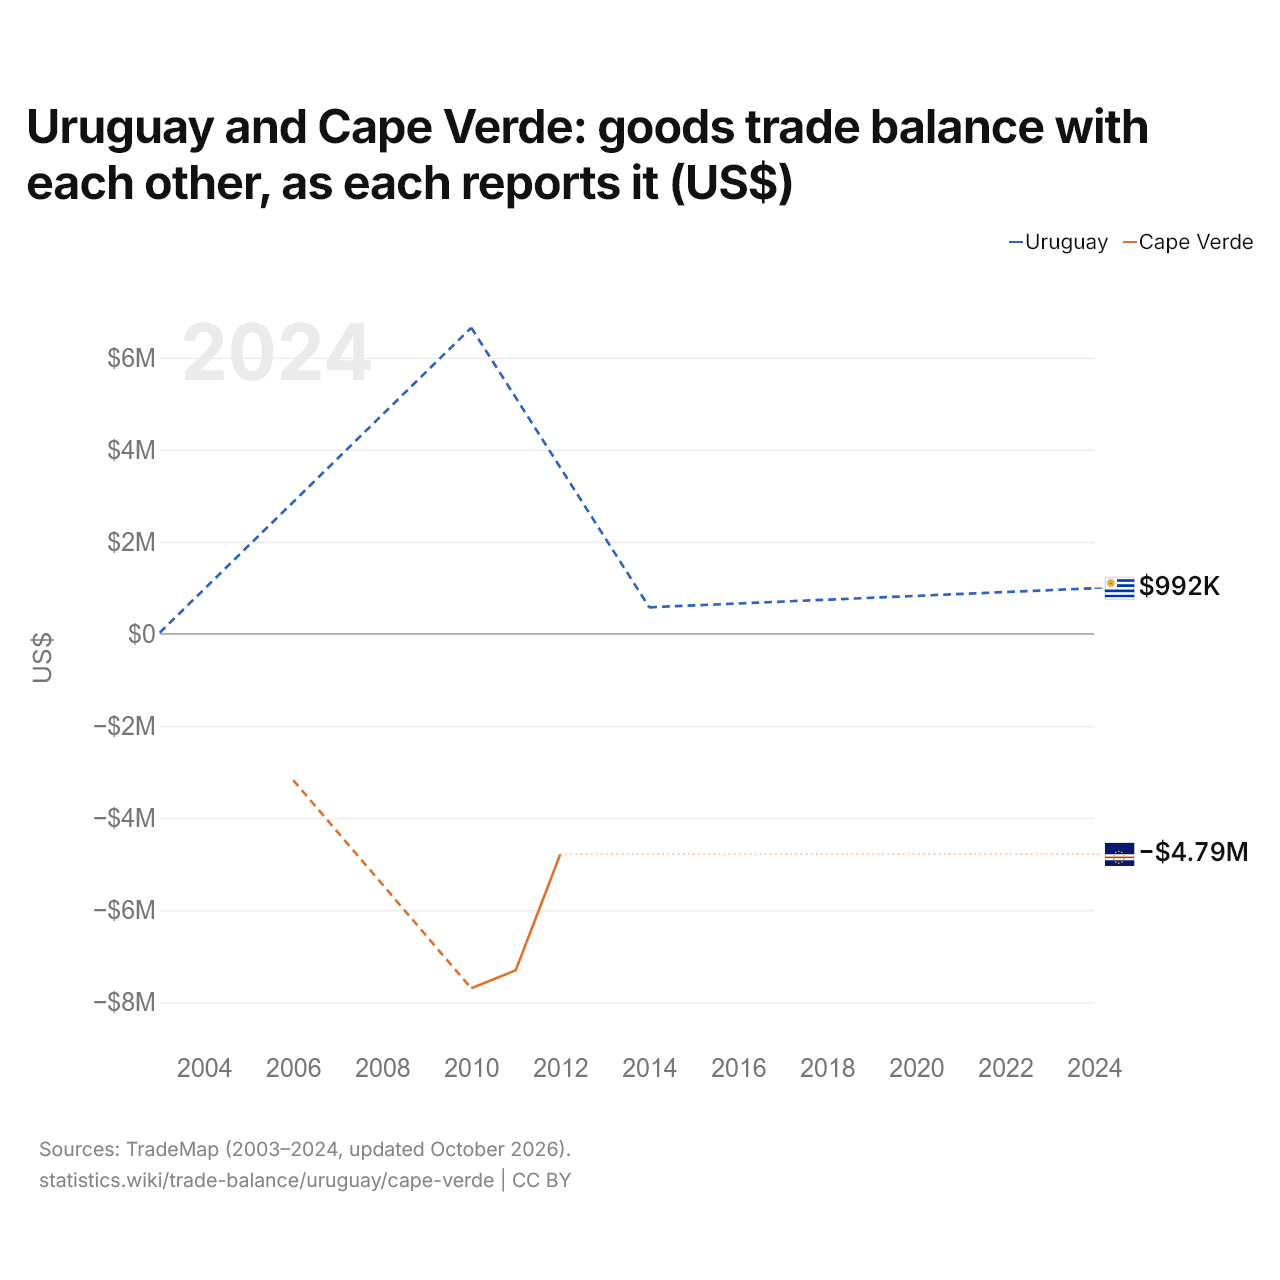
L'Uruguay et le Cap-Vert : solde de leur commerce de biens bilatéral, selon chacun ($ US)
| Année | $ US | |
|---|---|---|
| Uruguay | Cap-Vert | |
| 2024 | 992 000 $ US | - |
| 2023 | - | - |
| 2022 | - | - |
| 2021 | - | - |
| 2020 | - | - |
| 2019 | - | - |
| 2018 | - | - |
| 2017 | - | - |
| 2016 | - | - |
| 2015 | - | - |
| 2014 | 578 000 $ US | - |
| 2013 | - | - |
| 2012 | - | −4 786 000 $ US |
| 2011 | - | −7 307 000 $ US |
| 2010 | 6 652 000 $ US | −7 699 000 $ US |
| 2009 | - | - |
| 2008 | - | - |
| 2007 | - | - |
| 2006 | - | −3 177 000 $ US |
| 2005 | - | - |
| 2004 | - | - |
| 2003 | 26 000 $ US | - |
Selon l'Uruguay, son commerce de biens avec le Cap-Vert affichait un excédent de 6,65 millions de dollars ; selon le Cap-Vert, son commerce de biens avec l'Uruguay affichait un déficit de 7,7 millions de dollars.
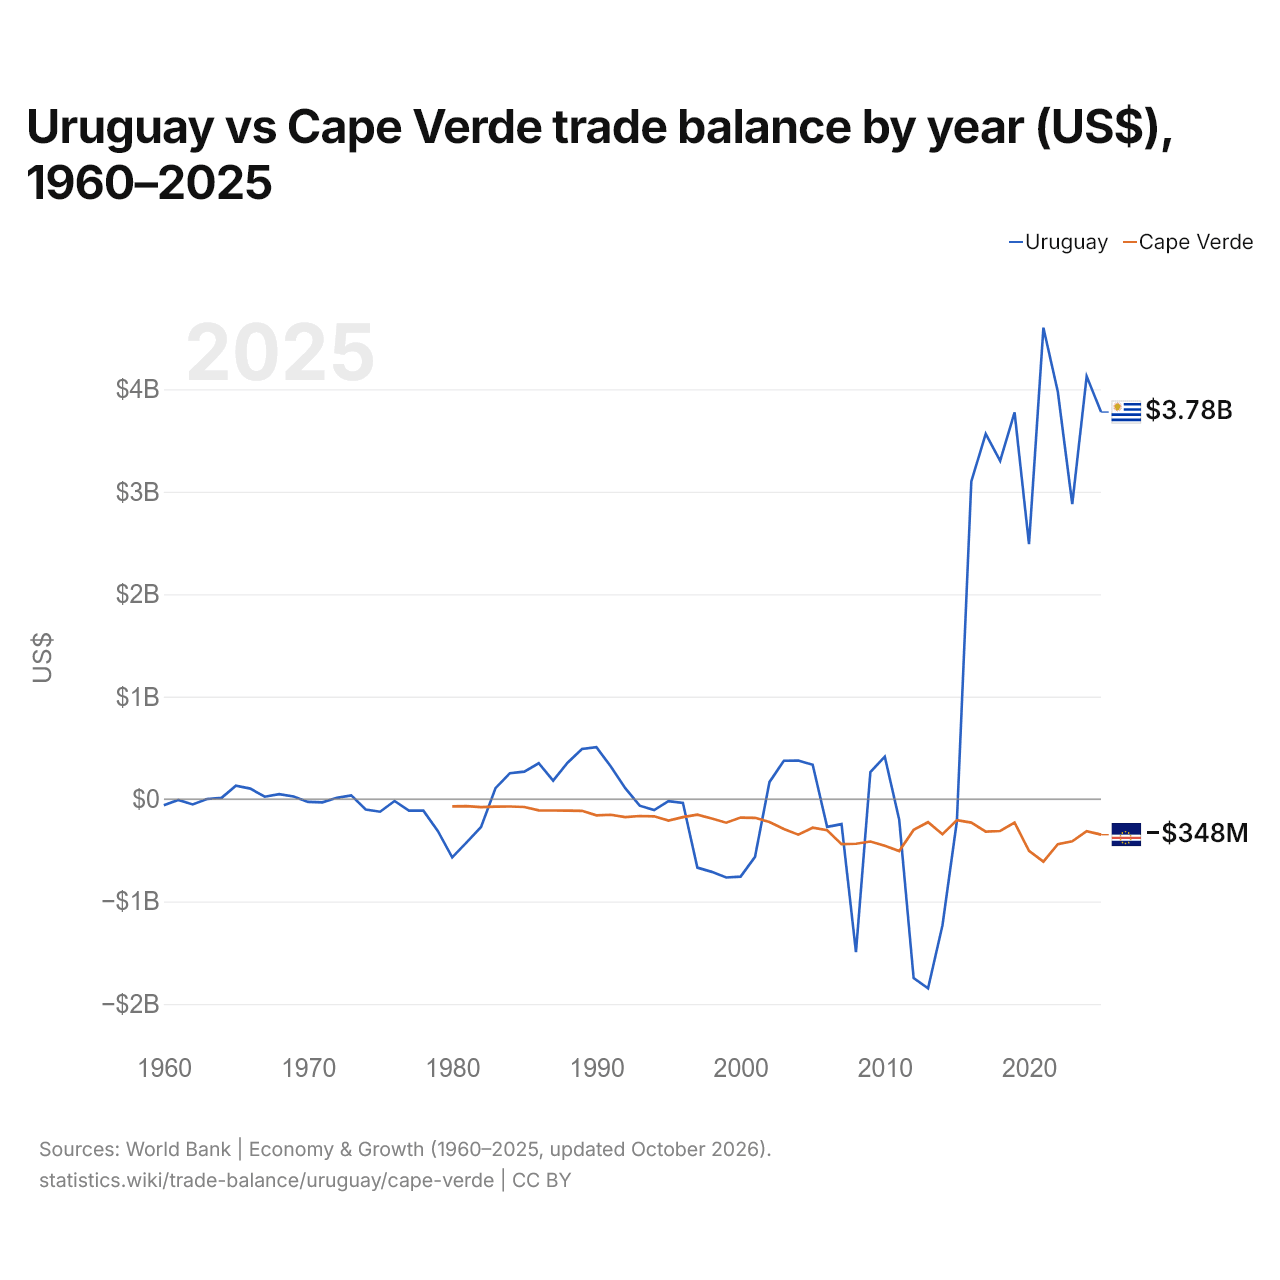
Uruguay vs Cap-Vert : balance commerciale par année ($ US), 1960–2025
| Année | $ US | |
|---|---|---|
 Uruguay |
 Cap-Vert |
|
| 2025 | 3 777 253 866 $ US | −347 732 516 $ US |
| 2024 | 4 125 675 249 $ US | −313 264 298 $ US |
| 2023 | 2 879 384 891 $ US | −412 532 539 $ US |
| 2022 | 3 975 224 553 $ US | −440 988 527 $ US |
| 2021 | 4 600 467 345 $ US | −610 535 249 $ US |
| 2020 | 2 487 655 573 $ US | −506 517 523 $ US |
| 2019 | 3 774 337 956 $ US | −229 555 185 $ US |
| 2018 | 3 301 104 909 $ US | −311 702 659 $ US |
| 2017 | 3 565 168 571 $ US | −317 771 966 $ US |
| 2016 | 3 099 838 873 $ US | −229 970 375 $ US |
| 2015 | −214 881 317 $ US | −205 399 753 $ US |
| 2014 | −1 231 338 665 $ US | −343 192 657 $ US |
| 2013 | −1 847 227 644 $ US | −225 943 230 $ US |
| 2012 | −1 747 306 849 $ US | −300 793 952 $ US |
| 2011 | −202 746 574 $ US | −507 773 134 $ US |
| 2010 | 414 029 879 $ US | −455 837 597 $ US |
| 2009 | 262 978 889 $ US | −414 650 594 $ US |
| 2008 | −1 494 377 960 $ US | −436 710 883 $ US |
| 2007 | −244 991 729 $ US | −440 686 737 $ US |
| 2006 | −271 753 629 $ US | −305 161 264 $ US |
| 2005 | 335 162 763 $ US | −279 899 813 $ US |
| 2004 | 376 087 086 $ US | −347 396 590 $ US |
| 2003 | 374 094 246 $ US | −293 096 458 $ US |
| 2002 | 165 220 880 $ US | −223 381 349 $ US |
| 2001 | −564 307 131 $ US | −183 257 219 $ US |
| 2000 | −757 171 200 $ US | −180 674 415 $ US |
| 1999 | −765 361 936 $ US | −231 143 988 $ US |
| 1998 | −710 854 144 $ US | −189 396 687 $ US |
| 1997 | −668 923 905 $ US | −152 559 146 $ US |
| 1996 | −38 666 891 $ US | −176 152 822 $ US |
| 1995 | −20 079 068 $ US | −210 651 243 $ US |
| 1994 | −107 505 932 $ US | −168 612 424 $ US |
| 1993 | −64 949 511 $ US | −165 686 386 $ US |
| 1992 | 105 872 034 $ US | −176 344 218 $ US |
| 1991 | 317 407 317 $ US | −152 959 920 $ US |
| 1990 | 505 462 238 $ US | −158 624 712 $ US |
| 1989 | 488 967 735 $ US | −114 967 856 $ US |
| 1988 | 354 986 095 $ US | −113 087 675 $ US |
| 1987 | 179 969 138 $ US | −112 061 708 $ US |
| 1986 | 349 657 276 $ US | −110 258 908 $ US |
| 1985 | 267 665 784 $ US | −77 877 487 $ US |
| 1984 | 252 463 025 $ US | −72 514 551 $ US |
| 1983 | 106 382 876 $ US | −73 642 842 $ US |
| 1982 | −272 143 888 $ US | −79 120 312 $ US |
| 1981 | −422 844 348 $ US | −68 654 777 $ US |
| 1980 | −568 972 169 $ US | −70 982 648 $ US |
| 1979 | −311 226 876 $ US | - |
| 1978 | −113 309 353 $ US | - |
| 1977 | −113 651 363 $ US | - |
| 1976 | −19 046 177 $ US | - |
| 1975 | −123 756 988 $ US | - |
| 1974 | −102 610 327 $ US | - |
| 1973 | 36 166 330 $ US | - |
| 1972 | 11 868 300 $ US | - |
| 1971 | −32 258 065 $ US | - |
| 1970 | −28 225 806 $ US | - |
| 1969 | 25 403 226 $ US | - |
| 1968 | 47 443 616 $ US | - |
| 1967 | 22 865 309 $ US | - |
| 1966 | 102 056 595 $ US | - |
| 1965 | 130 872 772 $ US | - |
| 1964 | 11 795 235 $ US | - |
| 1963 | 0 $ US | - |
| 1962 | −52 886 734 $ US | - |
| 1961 | −8 791 982 $ US | - |
| 1960 | −59 972 584 $ US | - |
En 2025, la balance commerciale de l'Uruguay affichait un excédent de 3,78 milliards de dollars et celle du Cap-Vert un déficit de 348 millions de dollars. En 1980, la balance commerciale de l'Uruguay affichait un déficit de 569 millions de dollars et celle du Cap-Vert un déficit de 71 millions de dollars.
De 1980 à 2025, la balance commerciale de l'Uruguay a été excédentaire pendant 26 des 46 années, et celle du Cap-Vert pendant aucune. Les balances commerciales de l'Uruguay et du Cap-Vert ont été déficitaires en même temps pendant 20 de ces années, la dernière fois en 2015.
Uruguay vs Cap-Vert : chiffres de la balance commerciale
|
Uruguay
|
Cap-Vert
|
|
|---|---|---|
| Biens et services, $ US | +3,78 Md $US (2025) | −348 M $US (2025) |
| % du PIB | +4,4 % (2025) | −11,4 % (2025) |
| Années d'excédent depuis 2000 | 16 sur 26 | 0 sur 26 |
| Solde des biens entre les deux, chiffres propres | +992 k $US (2024) | n.d. |
| Premier excédent en biens avec | Algérie (+314 M $US, 2025) | Libye (+143 k $US, 2025) |
| Premier déficit en biens avec | Chine (−1,19 Md $US, 2025) | Portugal (−521 M $US, 2025) |
Comparer la balance commerciale de 2 pays au choix
Sources :
- Banque mondiale | Économie et croissance (1960–2025, mis à jour en octobre 2026)
- TradeMap (2003–2025, mis à jour en octobre 2026)
Creative Commons Attribution (CC BY) : vous pouvez copier, partager, adapter et réutiliser ce contenu, y compris à des fins commerciales, à condition de citer statistics.wiki et d’indiquer les modifications apportées. Les sources citées ci-dessus peuvent avoir leurs propres conditions de licence.