
Finlande vs Danemark : importations de biens et services par année ($ US), 1966–2025
| Année | $ US | |
|---|---|---|
 Finlande |
 Danemark |
|
| 2025 | 130 205 696 940 $ US | 273 377 454 738 $ US |
| 2024 | 124 115 485 971 $ US | 257 954 032 293 $ US |
| 2023 | 126 181 886 286 $ US | 244 049 390 819 $ US |
| 2022 | 135 299 901 222 $ US | 245 032 442 024 $ US |
| 2021 | 117 299 452 992 $ US | 215 701 858 421 $ US |
| 2020 | 97 119 792 948 $ US | 175 669 403 452 $ US |
| 2019 | 106 661 292 345 $ US | 182 858 534 958 $ US |
| 2018 | 109 532 349 830 $ US | 184 150 748 808 $ US |
| 2017 | 95 883 949 215 $ US | 162 057 186 531 $ US |
| 2016 | 86 888 573 649 $ US | 148 938 310 649 $ US |
| 2015 | 84 376 236 306 $ US | 148 815 553 501 $ US |
| 2014 | 103 434 414 065 $ US | 170 691 434 960 $ US |
| 2013 | 106 039 600 487 $ US | 167 807 403 980 $ US |
| 2012 | 104 252 891 991 $ US | 161 048 079 536 $ US |
| 2011 | 109 358 964 446 $ US | 165 028 065 712 $ US |
| 2010 | 92 409 080 250 $ US | 141 177 531 238 $ US |
| 2009 | 86 296 583 224 $ US | 136 777 444 459 $ US |
| 2008 | 117 956 059 349 $ US | 179 262 473 078 $ US |
| 2007 | 100 068 194 989 $ US | 155 784 301 119 $ US |
| 2006 | 84 467 899 655 $ US | 132 470 258 290 $ US |
| 2005 | 74 385 401 475 $ US | 111 425 808 501 $ US |
| 2004 | 63 874 383 958 $ US | 96 223 902 121 $ US |
| 2003 | 52 757 320 690 $ US | 80 789 965 238 $ US |
| 2002 | 42 352 247 165 $ US | 69 404 219 160 $ US |
| 2001 | 39 524 131 051 $ US | 63 303 119 743 $ US |
| 2000 | 41 414 786 698 $ US | 62 604 702 033 $ US |
| 1999 | 38 733 513 445 $ US | 59 349 185 803 $ US |
| 1998 | 39 579 439 252 $ US | 60 376 476 242 $ US |
| 1997 | 38 637 040 431 $ US | 57 971 293 815 $ US |
| 1996 | 38 849 339 891 $ US | 58 923 841 033 $ US |
| 1995 | 37 987 472 767 $ US | 59 022 090 533 $ US |
| 1994 | 29 329 538 987 $ US | 48 298 831 714 $ US |
| 1993 | 23 895 076 507 $ US | 41 582 171 224 $ US |
| 1992 | 27 792 673 215 $ US | 45 947 462 931 $ US |
| 1991 | 28 389 942 655 $ US | 43 805 725 319 $ US |
| 1990 | 33 514 227 958 $ US | 42 672 845 232 $ US |
| 1989 | 29 576 001 108 $ US | 35 549 320 949 $ US |
| 1988 | 26 449 182 658 $ US | 34 827 127 089 $ US |
| 1987 | 22 422 561 883 $ US | 32 440 355 248 $ US |
| 1986 | 17 894 675 111 $ US | 28 623 980 349 $ US |
| 1985 | 15 264 773 599 $ US | 22 341 632 158 $ US |
| 1984 | 14 340 126 632 $ US | 20 459 800 031 $ US |
| 1983 | 14 637 062 340 $ US | 20 444 406 670 $ US |
| 1982 | 15 153 570 988 $ US | 21 123 371 538 $ US |
| 1981 | 15 896 941 306 $ US | 21 452 392 257 $ US |
| 1980 | 17 233 025 183 $ US | 23 438 722 476 $ US |
| 1979 | 12 688 139 215 $ US | 22 246 206 425 $ US |
| 1978 | 8 979 061 372 $ US | 17 888 293 983 $ US |
| 1977 | 8 555 407 998 $ US | 15 893 622 568 $ US |
| 1976 | 8 192 029 543 $ US | 14 607 323 077 $ US |
| 1975 | 8 310 974 624 $ US | 12 275 876 057 $ US |
| 1974 | 7 338 853 001 $ US | 11 616 217 493 $ US |
| 1973 | 4 849 296 717 $ US | 9 178 240 681 $ US |
| 1972 | 3 558 591 913 $ US | 6 229 703 999 $ US |
| 1971 | 3 116 111 111 $ US | 5 506 203 762 $ US |
| 1970 | 2 901 994 621 $ US | 5 119 854 667 $ US |
| 1969 | - | 4 438 459 867 $ US |
| 1968 | - | 3 829 653 733 $ US |
| 1967 | - | 3 762 160 847 $ US |
| 1966 | - | 3 533 468 959 $ US |
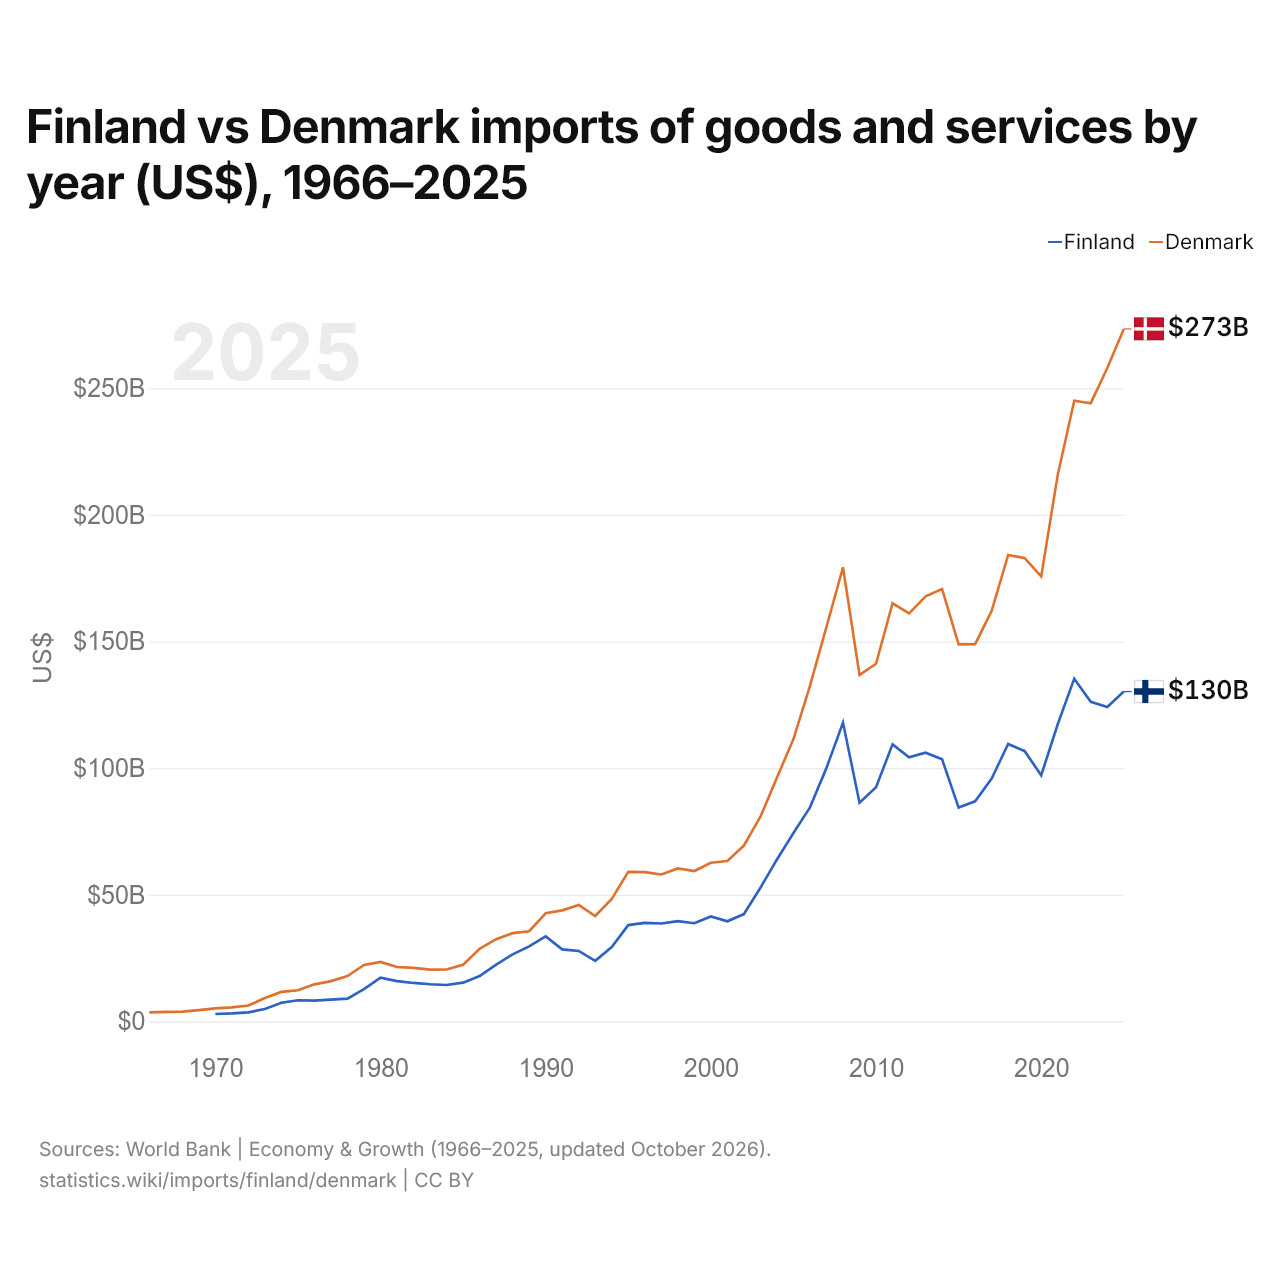
En 2025, les importations de biens et services de la Finlande s'élevaient à 130 milliards de dollars et celles du Danemark à 273 milliards de dollars : celles du Danemark étaient 2,1 fois plus élevées. En 1970, les importations du Danemark étaient 1,8 fois plus élevées : 2,9 milliards de dollars pour la Finlande et 5,12 milliards de dollars pour le Danemark.
Les importations de biens et services du Danemark sont supérieures à celles de la Finlande chaque année depuis 1970.
Finlande vs Danemark : chiffres des importations
|
Finlande
|
Danemark
|
|
|---|---|---|
| Importations | 130 Md $US (2025) | 273 Md $US (2025) |
| Rang mondial | 42/174 | 32/174 |
| Part mondiale | 0,39 % | 0,81 % |
| % du PIB | 41,1 % | 59,1 % |
| Première catégorie de biens | Machines, électronique et véhicules (38,1 %, 2025) | Machines, électronique et véhicules (39,1 %, 2025) |
| Première origine des biens | Allemagne (13,3 %, 2025) | Allemagne (19,3 %, 2025) |
Comparer les importations de 2 pays au choix
Sources :
- Banque mondiale | Économie et croissance (1966–2025, mis à jour en octobre 2026)
- TradeMap (2001–2025, mis à jour en octobre 2026)
Creative Commons Attribution (CC BY) : vous pouvez copier, partager, adapter et réutiliser ce contenu, y compris à des fins commerciales, à condition de citer statistics.wiki et d’indiquer les modifications apportées. Les sources citées ci-dessus peuvent avoir leurs propres conditions de licence.