
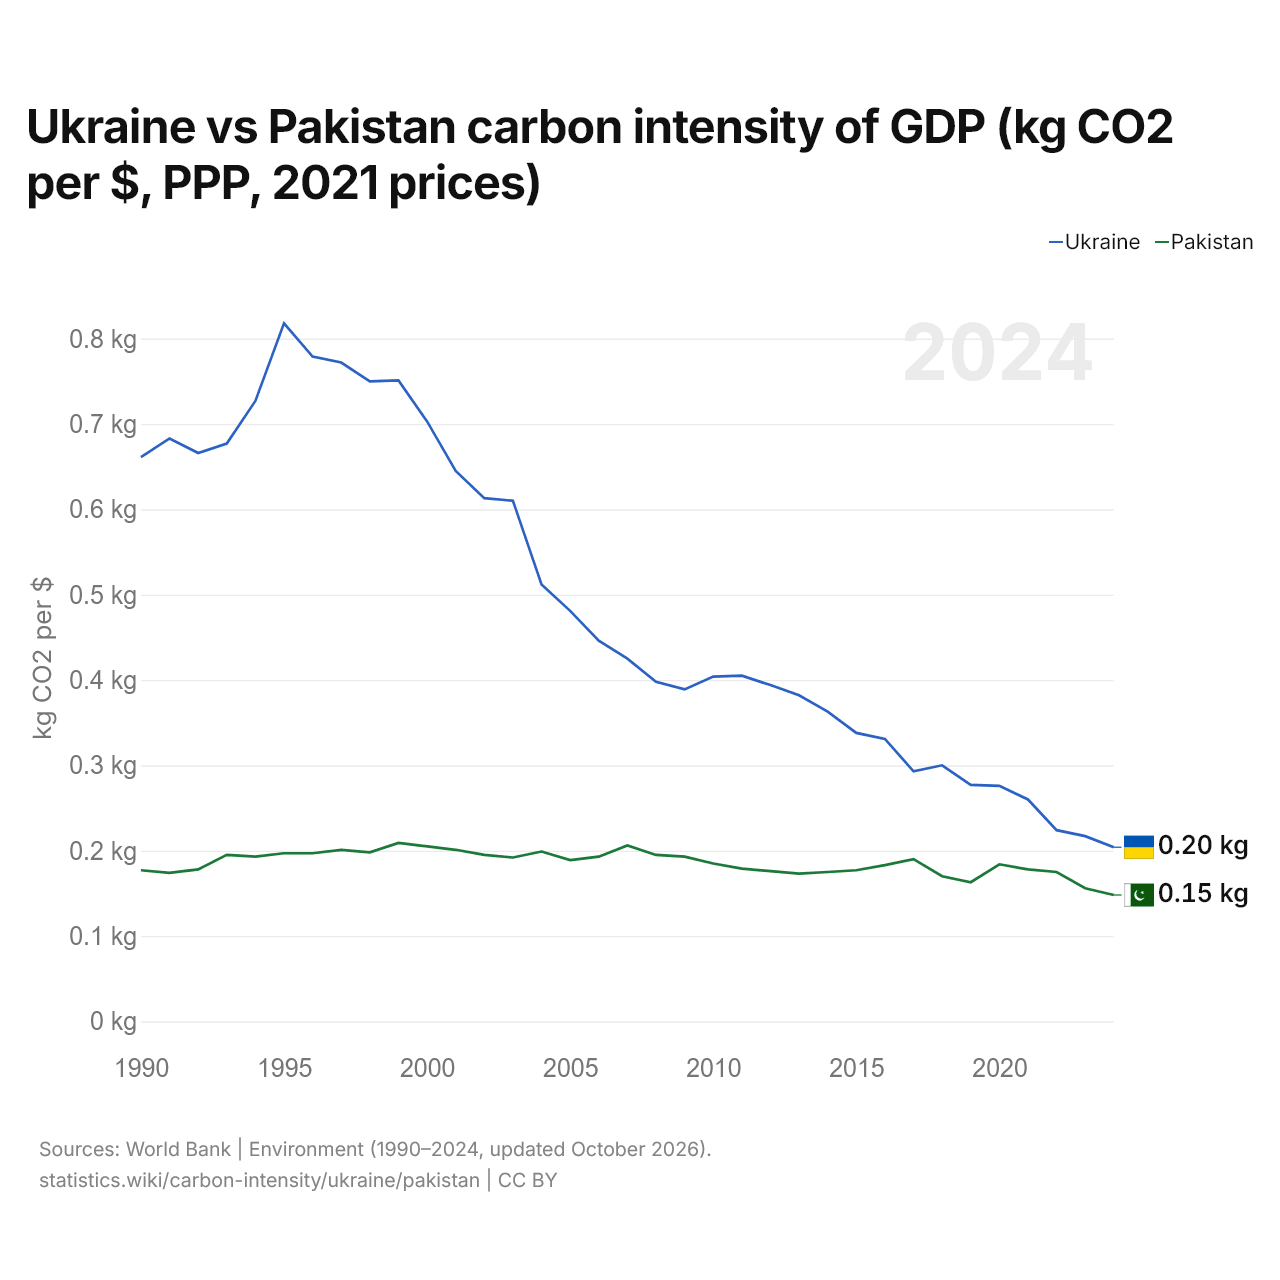
Ukraine vs Pakistan carbon intensity of GDP (kg CO2 per $, PPP, 2021 prices)
1x
| Year | kg CO2 per $ | |
|---|---|---|
 Ukraine |
 Pakistan |
|
| 2024 | 0.204 kg | 0.148 kg |
| 2023 | 0.217 kg | 0.156 kg |
| 2022 | 0.224 kg | 0.175 kg |
| 2021 | 0.26 kg | 0.178 kg |
| 2020 | 0.276 kg | 0.184 kg |
| 2019 | 0.277 kg | 0.163 kg |
| 2018 | 0.3 kg | 0.17 kg |
| 2017 | 0.293 kg | 0.19 kg |
| 2016 | 0.331 kg | 0.183 kg |
| 2015 | 0.338 kg | 0.177 kg |
| 2014 | 0.363 kg | 0.175 kg |
| 2013 | 0.382 kg | 0.173 kg |
| 2012 | 0.394 kg | 0.176 kg |
| 2011 | 0.405 kg | 0.179 kg |
| 2010 | 0.404 kg | 0.185 kg |
| 2009 | 0.389 kg | 0.193 kg |
| 2008 | 0.398 kg | 0.195 kg |
| 2007 | 0.425 kg | 0.206 kg |
| 2006 | 0.446 kg | 0.193 kg |
| 2005 | 0.481 kg | 0.189 kg |
| 2004 | 0.512 kg | 0.199 kg |
| 2003 | 0.61 kg | 0.192 kg |
| 2002 | 0.613 kg | 0.195 kg |
| 2001 | 0.645 kg | 0.201 kg |
| 2000 | 0.703 kg | 0.205 kg |
| 1999 | 0.751 kg | 0.209 kg |
| 1998 | 0.75 kg | 0.198 kg |
| 1997 | 0.772 kg | 0.201 kg |
| 1996 | 0.779 kg | 0.197 kg |
| 1995 | 0.818 kg | 0.197 kg |
| 1994 | 0.727 kg | 0.193 kg |
| 1993 | 0.677 kg | 0.195 kg |
| 1992 | 0.666 kg | 0.178 kg |
| 1991 | 0.683 kg | 0.174 kg |
| 1990 | 0.661 kg | 0.177 kg |
Carbon intensity is 0.204 kg of CO2 per dollar of GDP in Ukraine and 0.148 kg in Pakistan: 0.056 kg more in Ukraine. In 1990, Ukraine emitted 0.661 kg and Pakistan 0.177 kg, a difference of 0.484 kg.
Ukraine's carbon intensity has been higher than Pakistan's every year since 1990. The gap was widest in 1995, when Ukraine's carbon intensity was 0.621 kg above Pakistan's.
Ukraine vs Pakistan: latest carbon intensity of GDP
Compare the carbon intensity of GDP of any 2 countries
Sources:
- World Bank | Environment (1990–2024, updated October 2026)
Creative Commons Attribution (CC BY): you may copy, share, adapt and reuse this content, also commercially, as long as you credit statistics.wiki and note any changes you made. The sources listed above may have their own license terms.