
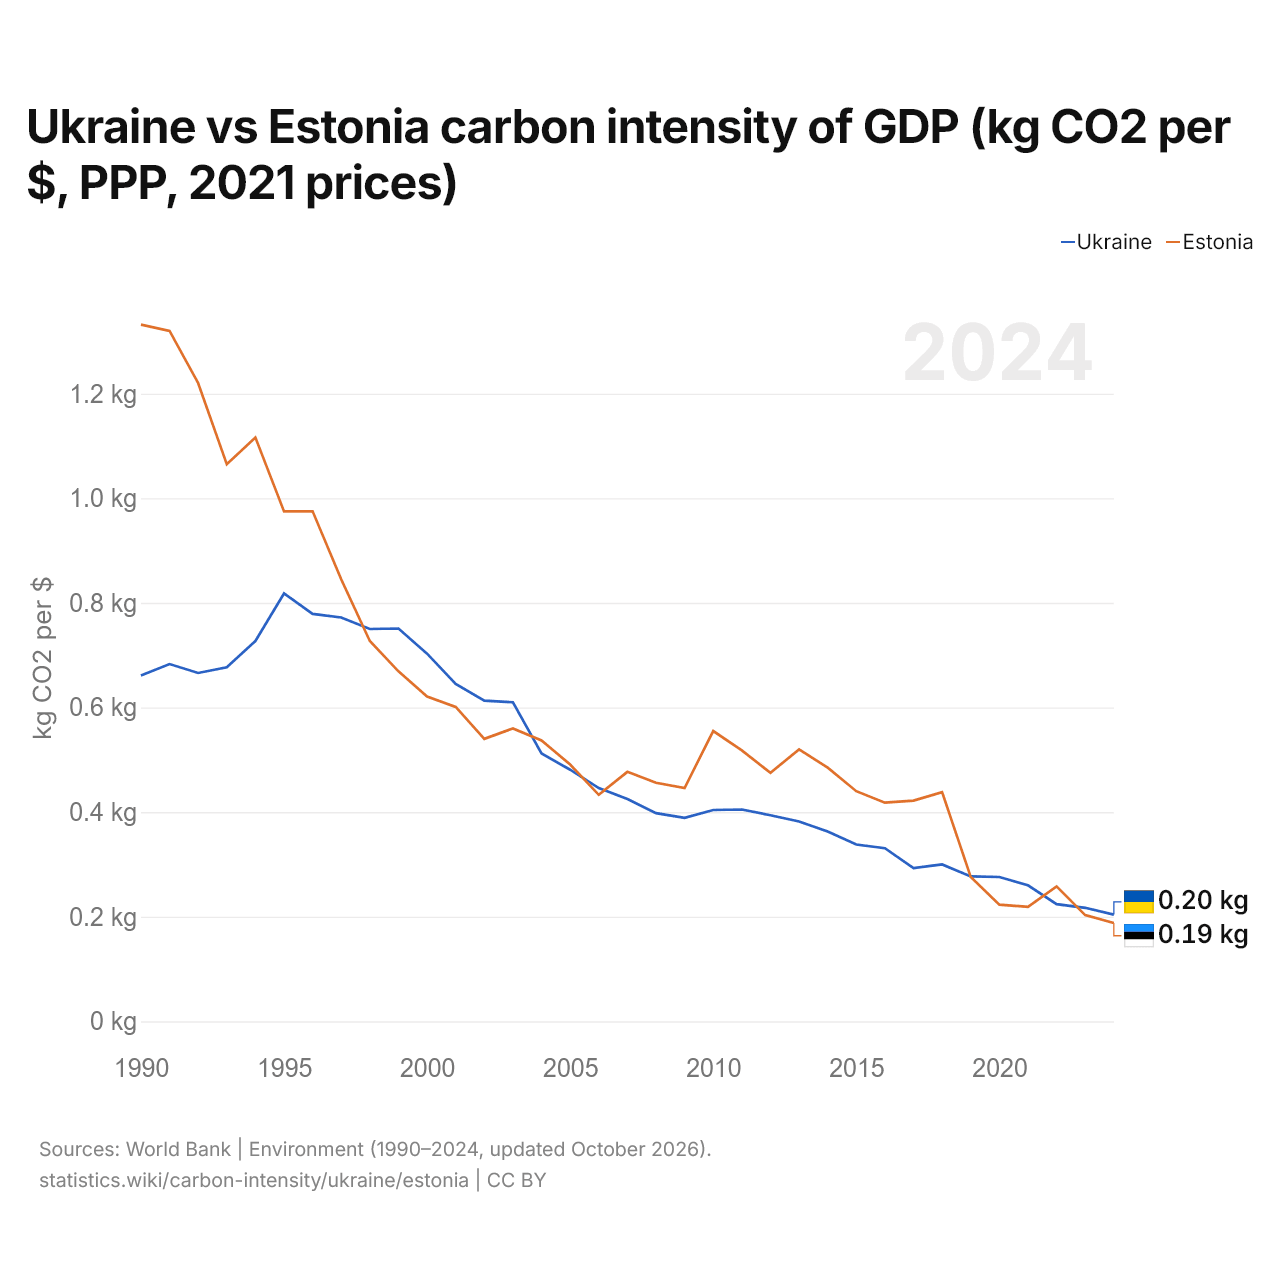
Ukraine vs Estonia carbon intensity of GDP (kg CO2 per $, PPP, 2021 prices)
1x
| Year | kg CO2 per $ | |
|---|---|---|
 Ukraine |
 Estonia |
|
| 2024 | 0.204 kg | 0.188 kg |
| 2023 | 0.217 kg | 0.203 kg |
| 2022 | 0.224 kg | 0.258 kg |
| 2021 | 0.26 kg | 0.219 kg |
| 2020 | 0.276 kg | 0.223 kg |
| 2019 | 0.277 kg | 0.276 kg |
| 2018 | 0.3 kg | 0.438 kg |
| 2017 | 0.293 kg | 0.422 kg |
| 2016 | 0.331 kg | 0.418 kg |
| 2015 | 0.338 kg | 0.44 kg |
| 2014 | 0.363 kg | 0.485 kg |
| 2013 | 0.382 kg | 0.52 kg |
| 2012 | 0.394 kg | 0.475 kg |
| 2011 | 0.405 kg | 0.518 kg |
| 2010 | 0.404 kg | 0.555 kg |
| 2009 | 0.389 kg | 0.446 kg |
| 2008 | 0.398 kg | 0.456 kg |
| 2007 | 0.425 kg | 0.477 kg |
| 2006 | 0.446 kg | 0.433 kg |
| 2005 | 0.481 kg | 0.491 kg |
| 2004 | 0.512 kg | 0.537 kg |
| 2003 | 0.61 kg | 0.56 kg |
| 2002 | 0.613 kg | 0.54 kg |
| 2001 | 0.645 kg | 0.601 kg |
| 2000 | 0.703 kg | 0.621 kg |
| 1999 | 0.751 kg | 0.669 kg |
| 1998 | 0.75 kg | 0.727 kg |
| 1997 | 0.772 kg | 0.845 kg |
| 1996 | 0.779 kg | 0.975 kg |
| 1995 | 0.818 kg | 0.975 kg |
| 1994 | 0.727 kg | 1.116 kg |
| 1993 | 0.677 kg | 1.065 kg |
| 1992 | 0.666 kg | 1.22 kg |
| 1991 | 0.683 kg | 1.32 kg |
| 1990 | 0.661 kg | 1.332 kg |
Carbon intensity is 0.204 kg of CO2 per dollar of GDP in Ukraine and 0.188 kg in Estonia: 0.016 kg more in Ukraine. In 1990, Ukraine emitted 0.661 kg and Estonia 1.332 kg, a difference of 0.671 kg.
Ukraine vs Estonia: latest carbon intensity of GDP
Compare the carbon intensity of GDP of any 2 countries
Sources:
- World Bank | Environment (1990–2024, updated October 2026)
Creative Commons Attribution (CC BY): you may copy, share, adapt and reuse this content, also commercially, as long as you credit statistics.wiki and note any changes you made. The sources listed above may have their own license terms.