
Malawi vs Israel carbon intensity of GDP (kg CO2 per $, PPP, 2021 prices)
1x
| Year | kg CO2 per $ | |
|---|---|---|
 Malawi |
 Israel |
|
| 2024 | 0.135 kg | 0.122 kg |
| 2023 | 0.135 kg | 0.129 kg |
| 2022 | 0.164 kg | 0.138 kg |
| 2021 | 0.181 kg | 0.141 kg |
| 2020 | 0.161 kg | 0.155 kg |
| 2019 | 0.175 kg | 0.162 kg |
| 2018 | 0.18 kg | 0.163 kg |
| 2017 | 0.186 kg | 0.181 kg |
| 2016 | 0.175 kg | 0.189 kg |
| 2015 | 0.18 kg | 0.198 kg |
| 2014 | 0.187 kg | 0.197 kg |
| 2013 | 0.2 kg | 0.211 kg |
| 2012 | 0.238 kg | 0.25 kg |
| 2011 | 0.245 kg | 0.235 kg |
| 2010 | 0.201 kg | 0.25 kg |
| 2009 | 0.199 kg | 0.246 kg |
| 2008 | 0.222 kg | 0.252 kg |
| 2007 | 0.228 kg | 0.259 kg |
| 2006 | 0.232 kg | 0.265 kg |
| 2005 | 0.229 kg | 0.267 kg |
| 2004 | 0.208 kg | 0.288 kg |
| 2003 | 0.22 kg | 0.302 kg |
| 2002 | 0.231 kg | 0.298 kg |
| 2001 | 0.238 kg | 0.282 kg |
| 2000 | 0.221 kg | 0.283 kg |
| 1999 | 0.199 kg | 0.285 kg |
| 1998 | 0.199 kg | 0.287 kg |
| 1997 | 0.195 kg | 0.295 kg |
| 1996 | 0.18 kg | 0.296 kg |
| 1995 | 0.18 kg | 0.295 kg |
| 1994 | 0.206 kg | 0.294 kg |
| 1993 | 0.177 kg | 0.295 kg |
| 1992 | 0.192 kg | 0.28 kg |
| 1991 | 0.163 kg | 0.282 kg |
| 1990 | 0.154 kg | 0.298 kg |
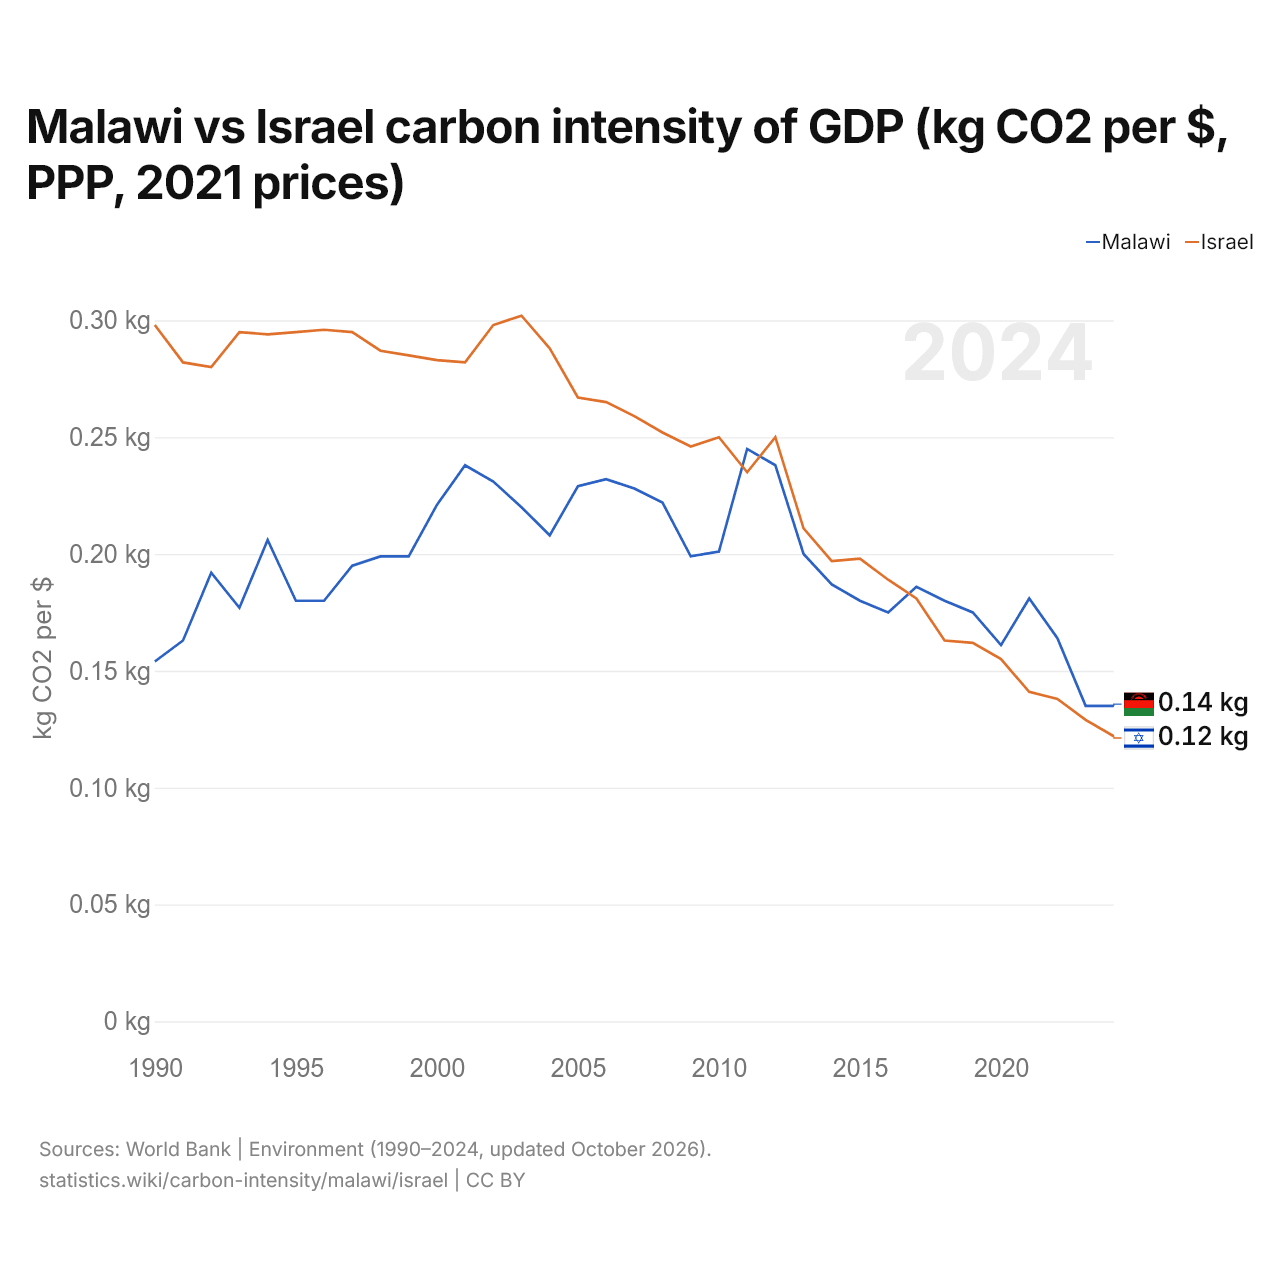
Carbon intensity is 0.135 kg of CO2 per dollar of GDP in Malawi and 0.122 kg in Israel: 0.013 kg more in Malawi. In 1990, Malawi emitted 0.154 kg and Israel 0.298 kg, a difference of 0.144 kg.
Malawi's carbon intensity has been higher than Israel's every year since 2017.
Malawi vs Israel: latest carbon intensity of GDP
Compare the carbon intensity of GDP of any 2 countries
Sources:
- World Bank | Environment (1990–2024, updated October 2026)
Creative Commons Attribution (CC BY): you may copy, share, adapt and reuse this content, also commercially, as long as you credit statistics.wiki and note any changes you made. The sources listed above may have their own license terms.