
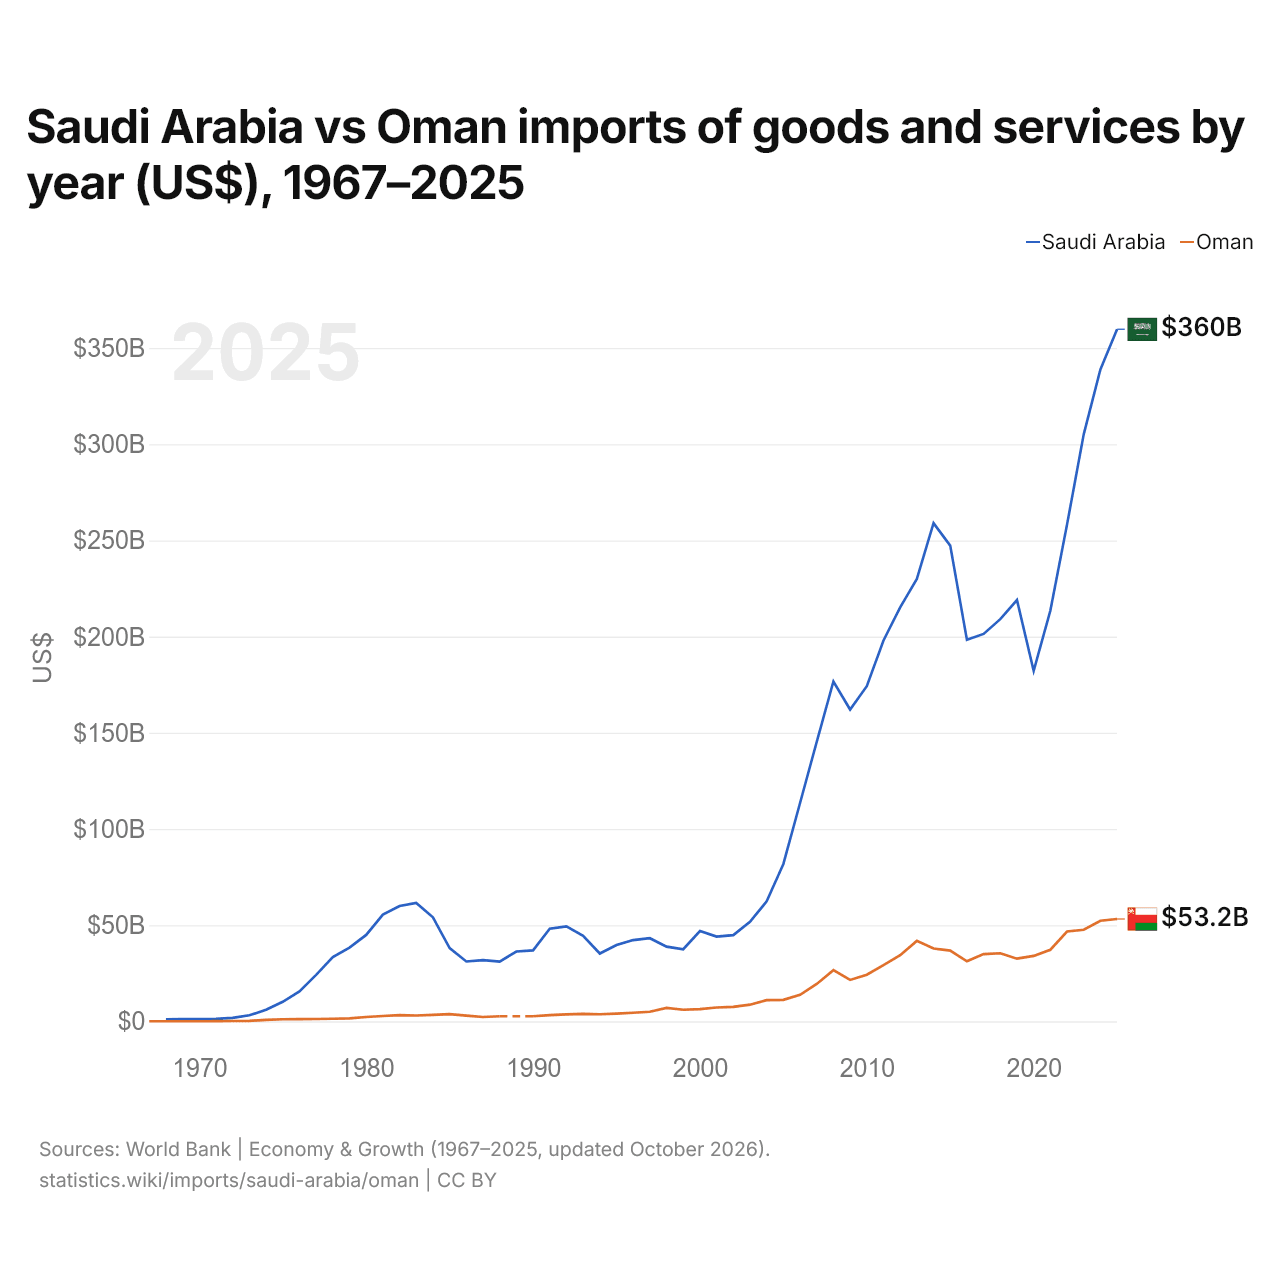
Arábia Saudita vs Omã: importações de bens e serviços por ano (US$), 1967–2025
1x
| Ano | US$ | |
|---|---|---|
 Arábia Saudita |
 Omã |
|
| 2025 | US$ 359.757.600.000 | US$ 53.205.941.136 |
| 2024 | US$ 338.830.400.000 | US$ 52.261.638.492 |
| 2023 | US$ 305.152.000.000 | US$ 47.632.509.753 |
| 2022 | US$ 258.212.800.000 | US$ 46.681.404.421 |
| 2021 | US$ 213.515.200.000 | US$ 37.217.165.150 |
| 2020 | US$ 182.183.733.333 | US$ 34.023.407.022 |
| 2019 | US$ 218.974.666.667 | US$ 32.569.570.871 |
| 2018 | US$ 209.069.066.667 | US$ 35.373.211.964 |
| 2017 | US$ 201.397.866.667 | US$ 34.959.687.906 |
| 2016 | US$ 198.364.800.000 | US$ 31.211.963.589 |
| 2015 | US$ 247.307.200.000 | US$ 36.777.633.290 |
| 2014 | US$ 259.006.933.333 | US$ 37.856.957.087 |
| 2013 | US$ 229.995.200.000 | US$ 41.830.949.285 |
| 2012 | US$ 215.206.133.333 | US$ 34.397.919.376 |
| 2011 | US$ 197.977.600.000 | US$ 29.235.370.611 |
| 2010 | US$ 174.202.666.667 | US$ 24.236.671.001 |
| 2009 | US$ 162.069.066.667 | US$ 21.537.061.118 |
| 2008 | US$ 176.684.800.000 | US$ 26.587.776.333 |
| 2007 | US$ 145.279.252.835 | US$ 19.440.832.250 |
| 2006 | US$ 113.494.793.057 | US$ 13.778.933.680 |
| 2005 | US$ 81.797.389.982 | US$ 11.172.951.886 |
| 2004 | US$ 62.350.400.000 | US$ 11.024.707.412 |
| 2003 | US$ 51.744.266.667 | US$ 8.657.997.399 |
| 2002 | US$ 44.830.400.000 | US$ 7.513.654.096 |
| 2001 | US$ 44.058.400.000 | US$ 7.209.362.809 |
| 2000 | US$ 46.926.133.333 | US$ 6.351.105.332 |
| 1999 | US$ 37.485.333.333 | US$ 6.013.003.901 |
| 1998 | US$ 38.830.933.333 | US$ 7.003.901.170 |
| 1997 | US$ 43.199.465.955 | US$ 4.993.498.049 |
| 1996 | US$ 42.253.404.539 | US$ 4.468.140.442 |
| 1995 | US$ 39.711.615.487 | US$ 4.010.403.121 |
| 1994 | US$ 35.240.587.450 | US$ 3.672.301.691 |
| 1993 | US$ 44.483.311.081 | US$ 3.882.964.889 |
| 1992 | US$ 49.331.375.167 | US$ 3.615.084.525 |
| 1991 | US$ 48.117.222.964 | US$ 3.219.765.930 |
| 1990 | US$ 36.904.405.874 | US$ 2.634.590.377 |
| 1989 | US$ 36.304.672.897 | - |
| 1988 | US$ 31.068.624.833 | US$ 2.629.388.817 |
| 1987 | US$ 31.821.094.793 | US$ 2.270.480.884 |
| 1986 | US$ 31.120.442.884 | US$ 2.997.523.182 |
| 1985 | US$ 38.070.679.183 | US$ 3.720.377.828 |
| 1984 | US$ 54.097.332.577 | US$ 3.315.025.608 |
| 1983 | US$ 61.584.659.913 | US$ 3.019.687.319 |
| 1982 | US$ 59.945.084.420 | US$ 3.259.988.419 |
| 1981 | US$ 55.459.144.516 | US$ 2.764.910.539 |
| 1980 | US$ 44.919.924.659 | US$ 2.252.461.204 |
| 1979 | US$ 38.304.743.729 | US$ 1.519.976.549 |
| 1978 | US$ 33.389.007.172 | US$ 1.335.263.173 |
| 1977 | US$ 24.156.717.678 | US$ 1.207.295.599 |
| 1976 | US$ 15.522.379.603 | US$ 1.176.896.642 |
| 1975 | US$ 10.165.134.756 | US$ 1.062.826.288 |
| 1974 | US$ 5.995.492.958 | US$ 786.045.165 |
| 1973 | US$ 3.126.324.499 | US$ 266.627.884 |
| 1972 | US$ 1.765.847.084 | US$ 160.511.552 |
| 1971 | US$ 1.287.323.408 | US$ 96.727.623 |
| 1970 | US$ 1.159.555.556 | US$ 50.399.960 |
| 1969 | US$ 1.118.868.489 | US$ 28.559.977 |
| 1968 | US$ 1.035.019.956 | US$ 27.839.978 |
| 1967 | - | US$ 24.026.313 |
Em 2025, as importações de bens e serviços da Arábia Saudita foram de US$ 360 bilhões e as de Omã, de US$ 53,2 bilhões: as da Arábia Saudita foram 6,8 vezes maiores. Em 1968, as importações da Arábia Saudita foram 37 vezes maiores: US$ 1,04 bilhão da Arábia Saudita e US$ 27,8 milhões de Omã.
Arábia Saudita vs Omã: dados de importações
|
Arábia Saudita
|
Omã
|
|
|---|---|---|
| Importações | US$ 360 bi (2025) | US$ 53,2 bi (2025) |
| Posição mundial | 27/174 | 67/174 |
| Participação mundial | 1,07% | 0,16% |
| % do PIB | 28,2% | 48,5% |
| Maior categoria de bens | Máquinas, eletrônicos e veículos (45,4%, 2025) | Máquinas, eletrônicos e veículos (30,8%, 2025) |
| Principal origem dos bens | China (27,4%, 2025) | China (16,3%, 2025) |
Comparar as importações de 2 países quaisquer
Fontes:
- Banco Mundial | Economy & Growth (1967–2025, atualizado em outubro de 2026)
- TradeMap (2001–2025, atualizado em outubro de 2026)
Creative Commons Atribuição (CC BY): você pode copiar, compartilhar, adaptar e reutilizar este conteúdo, inclusive para fins comerciais, desde que cite o statistics.wiki e indique as alterações que fizer. As fontes listadas acima podem ter suas próprias condições de licença.