
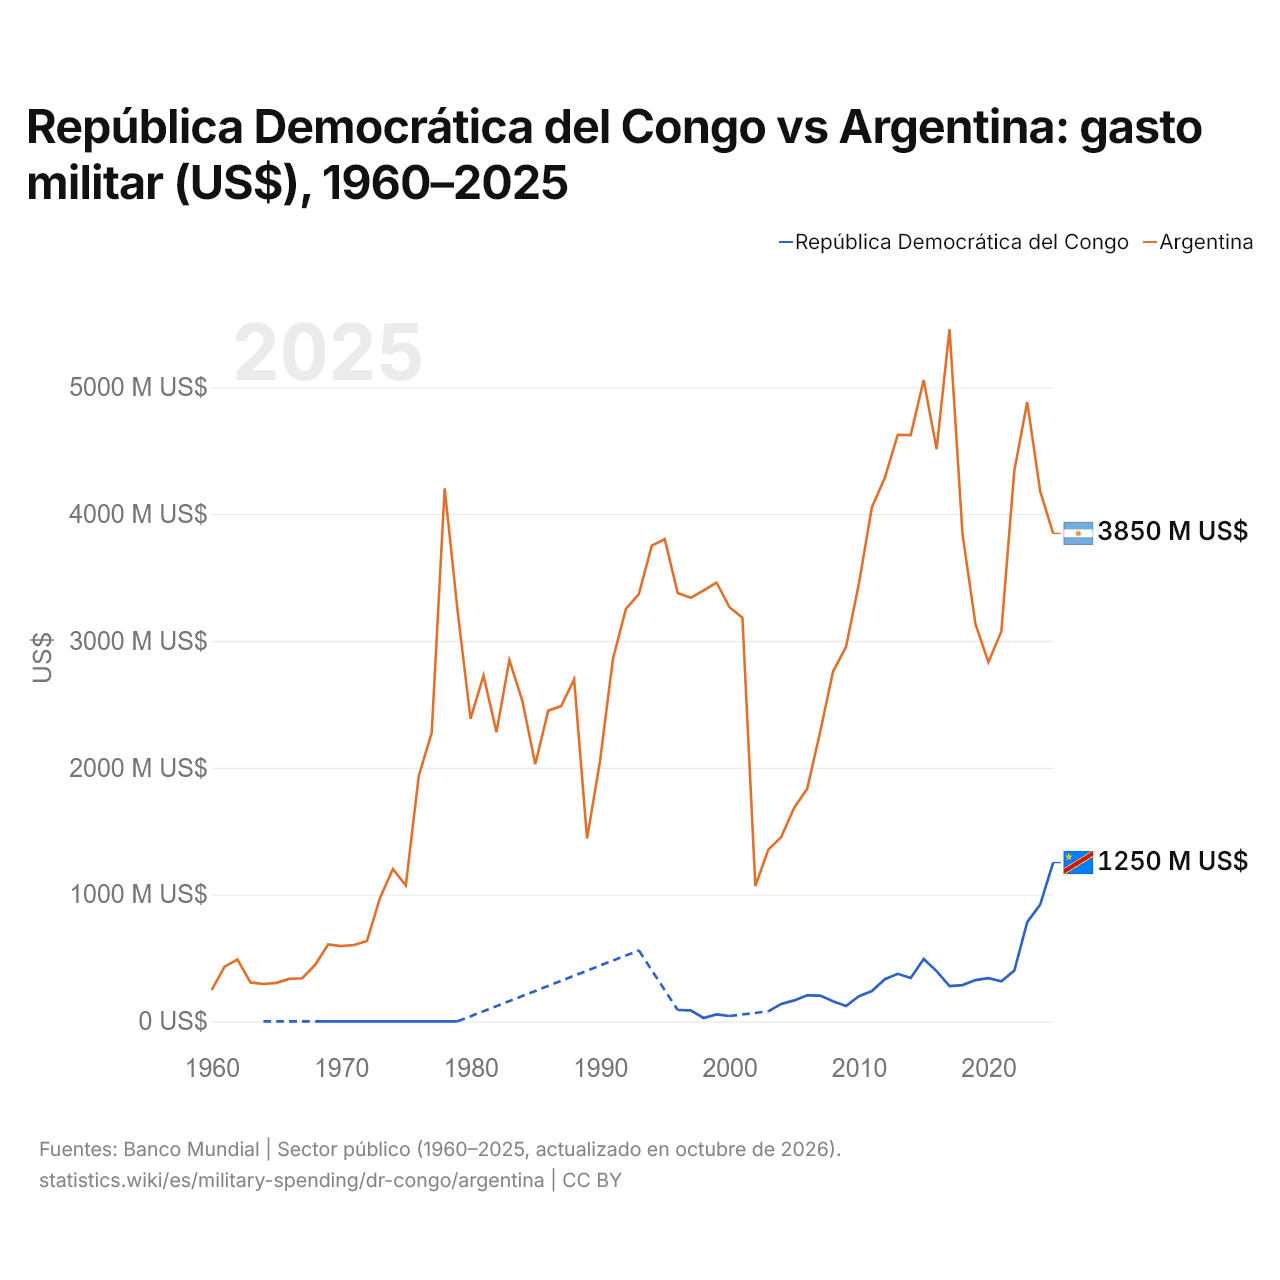
República Democrática del Congo vs Argentina: gasto militar (US$), 1960–2025
| Año | US$ | |
|---|---|---|
 RDC |
 Argentina |
|
| 2025 | 1.251.802.003 US$ | 3.847.030.490 US$ |
| 2024 | 920.516.916 US$ | 4.179.838.658 US$ |
| 2023 | 781.452.695 US$ | 4.882.352.994 US$ |
| 2022 | 399.792.740 US$ | 4.340.235.091 US$ |
| 2021 | 314.934.274 US$ | 3.074.056.518 US$ |
| 2020 | 340.727.945 US$ | 2.831.765.795 US$ |
| 2019 | 325.118.715 US$ | 3.132.922.213 US$ |
| 2018 | 285.720.622 US$ | 3.843.257.896 US$ |
| 2017 | 278.367.272 US$ | 5.456.390.671 US$ |
| 2016 | 395.897.167 US$ | 4.511.804.451 US$ |
| 2015 | 491.550.105 US$ | 5.056.133.759 US$ |
| 2014 | 341.224.631 US$ | 4.621.617.919 US$ |
| 2013 | 374.568.041 US$ | 4.624.515.687 US$ |
| 2012 | 332.493.969 US$ | 4.285.004.735 US$ |
| 2011 | 238.787.473 US$ | 4.051.930.111 US$ |
| 2010 | 198.429.561 US$ | 3.452.047.165 US$ |
| 2009 | 121.247.868 US$ | 2.951.865.094 US$ |
| 2008 | 158.461.763 US$ | 2.757.807.340 US$ |
| 2007 | 203.246.740 US$ | 2.278.817.797 US$ |
| 2006 | 205.102.168 US$ | 1.833.095.114 US$ |
| 2005 | 165.205.068 US$ | 1.683.610.808 US$ |
| 2004 | 137.636.618 US$ | 1.454.415.858 US$ |
| 2003 | 78.708.312 US$ | 1.353.563.895 US$ |
| 2002 | - | 1.067.029.325 US$ |
| 2001 | - | 3.181.997.039 US$ |
| 2000 | 42.043.484 US$ | 3.264.997.128 US$ |
| 1999 | 54.563.482 US$ | 3.460.000.000 US$ |
| 1998 | 26.640.448 US$ | 3.397.002.841 US$ |
| 1997 | 85.932.666 US$ | 3.339.000.000 US$ |
| 1996 | 89.272.959 US$ | 3.377.996.897 US$ |
| 1995 | - | 3.800.996.317 US$ |
| 1994 | - | 3.751.000.000 US$ |
| 1993 | 559.518.318 US$ | 3.368.367.988 US$ |
| 1992 | - | 3.251.456.838 US$ |
| 1991 | - | 2.858.940.824 US$ |
| 1990 | - | 2.050.898.683 US$ |
| 1989 | - | 1.440.919.053 US$ |
| 1988 | - | 2.696.340.375 US$ |
| 1987 | - | 2.485.661.588 US$ |
| 1986 | - | 2.449.546.586 US$ |
| 1985 | - | 2.027.221.261 US$ |
| 1984 | - | 2.527.749.192 US$ |
| 1983 | - | 2.847.793.071 US$ |
| 1982 | - | 2.280.144.825 US$ |
| 1981 | - | 2.726.425.231 US$ |
| 1980 | - | 2.385.017.949 US$ |
| 1979 | 4.480 US$ | 3.236.408.047 US$ |
| 1978 | 5.032 US$ | 4.202.371.974 US$ |
| 1977 | 4.311 US$ | 2.276.123.224 US$ |
| 1976 | 3.240 US$ | 1.934.867.782 US$ |
| 1975 | 4.639 US$ | 1.070.775.188 US$ |
| 1974 | 5.054 US$ | 1.201.859.183 US$ |
| 1973 | 2.747 US$ | 971.313.374 US$ |
| 1972 | 2.485 US$ | 633.463.772 US$ |
| 1971 | 2.717 US$ | 601.838.599 US$ |
| 1970 | 2.691 US$ | 593.081.284 US$ |
| 1969 | 2.100 US$ | 605.590.513 US$ |
| 1968 | 1.648 US$ | 445.649.879 US$ |
| 1967 | - | 339.593.346 US$ |
| 1966 | 1.954 US$ | 334.403.945 US$ |
| 1965 | - | 303.288.354 US$ |
| 1964 | 1.128 US$ | 294.460.368 US$ |
| 1963 | - | 306.971.678 US$ |
| 1962 | - | 487.782.584 US$ |
| 1961 | - | 430.829.516 US$ |
| 1960 | - | 245.914.852 US$ |
En 2025, el gasto militar fue de 1,25 mil millones de US$ en la República Democrática del Congo y de 3,85 mil millones de US$ en Argentina: 3,1 veces más en Argentina. En 1964 fue de 1130 US$ en la República Democrática del Congo y de 294 millones de US$ en Argentina, 260.000 veces más en Argentina.
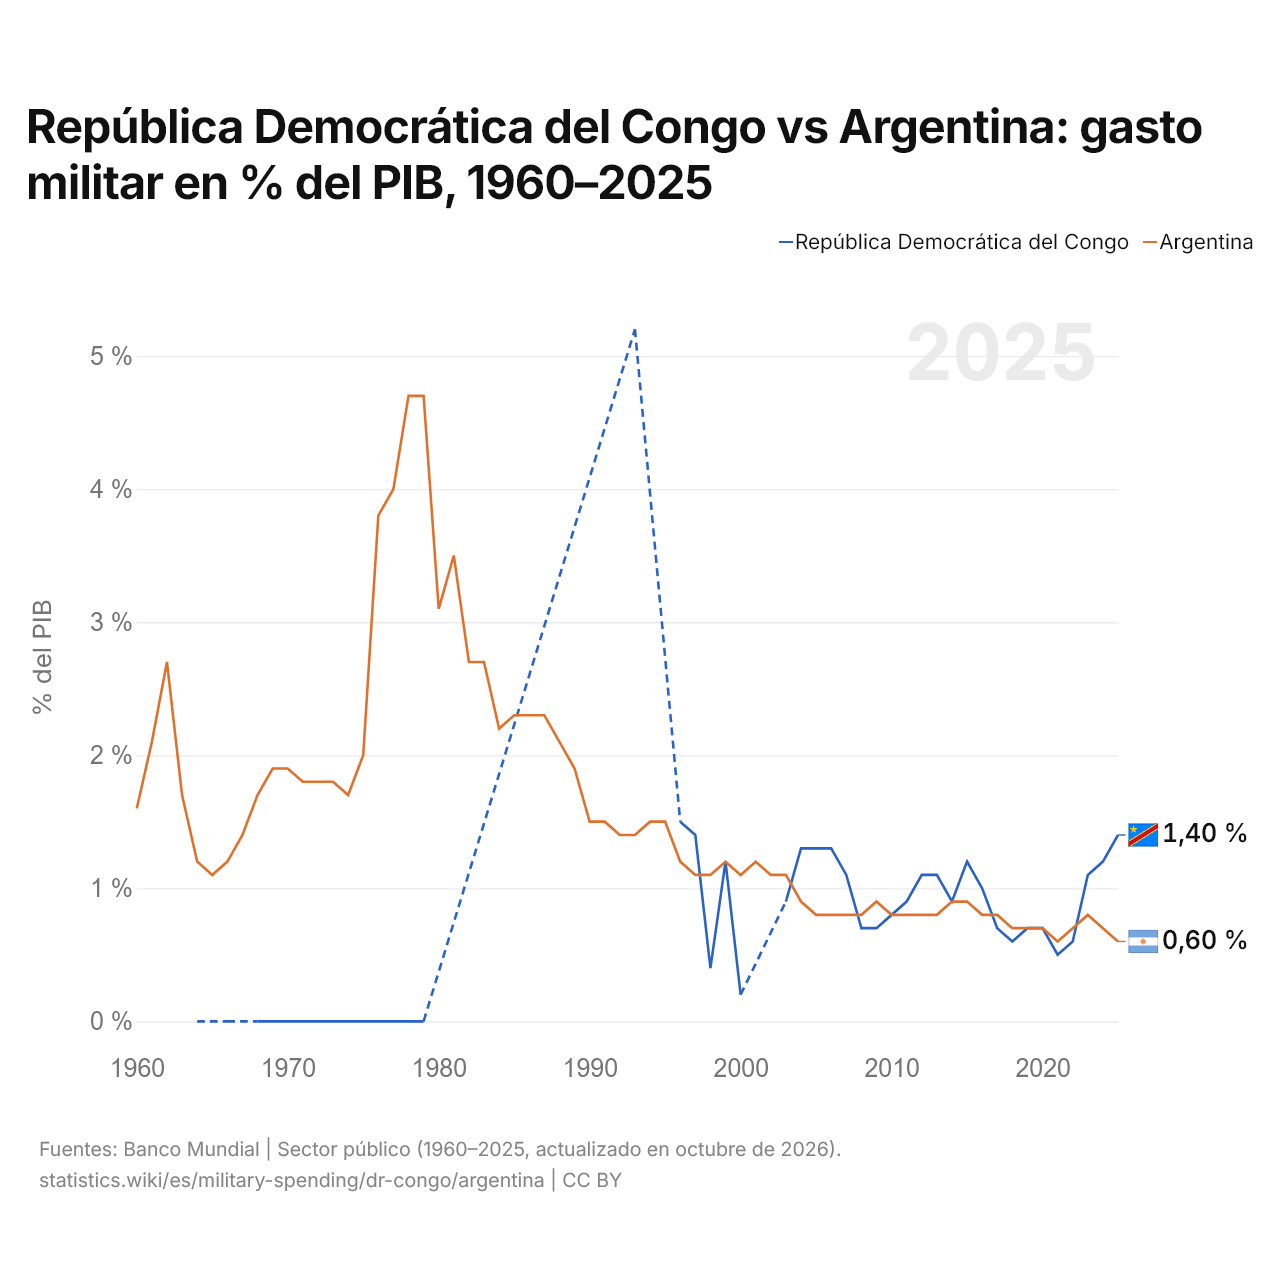
República Democrática del Congo vs Argentina: gasto militar en % del PIB, 1960–2025
| Año | % del PIB | |
|---|---|---|
|
RDC
|
Argentina
|
|
| 2025 | 1,4 % | 0,6 % |
| 2024 | 1,2 % | 0,7 % |
| 2023 | 1,1 % | 0,8 % |
| 2022 | 0,6 % | 0,7 % |
| 2021 | 0,5 % | 0,6 % |
| 2020 | 0,7 % | 0,7 % |
| 2019 | 0,7 % | 0,7 % |
| 2018 | 0,6 % | 0,7 % |
| 2017 | 0,7 % | 0,8 % |
| 2016 | 1 % | 0,8 % |
| 2015 | 1,2 % | 0,9 % |
| 2014 | 0,9 % | 0,9 % |
| 2013 | 1,1 % | 0,8 % |
| 2012 | 1,1 % | 0,8 % |
| 2011 | 0,9 % | 0,8 % |
| 2010 | 0,8 % | 0,8 % |
| 2009 | 0,7 % | 0,9 % |
| 2008 | 0,7 % | 0,8 % |
| 2007 | 1,1 % | 0,8 % |
| 2006 | 1,3 % | 0,8 % |
| 2005 | 1,3 % | 0,8 % |
| 2004 | 1,3 % | 0,9 % |
| 2003 | 0,9 % | 1,1 % |
| 2002 | - | 1,1 % |
| 2001 | - | 1,2 % |
| 2000 | 0,2 % | 1,1 % |
| 1999 | 1,2 % | 1,2 % |
| 1998 | 0,4 % | 1,1 % |
| 1997 | 1,4 % | 1,1 % |
| 1996 | 1,5 % | 1,2 % |
| 1995 | - | 1,5 % |
| 1994 | - | 1,5 % |
| 1993 | 5,2 % | 1,4 % |
| 1992 | - | 1,4 % |
| 1991 | - | 1,5 % |
| 1990 | - | 1,5 % |
| 1989 | - | 1,9 % |
| 1988 | - | 2,1 % |
| 1987 | - | 2,3 % |
| 1986 | - | 2,3 % |
| 1985 | - | 2,3 % |
| 1984 | - | 2,2 % |
| 1983 | - | 2,7 % |
| 1982 | - | 2,7 % |
| 1981 | - | 3,5 % |
| 1980 | - | 3,1 % |
| 1979 | 0 % | 4,7 % |
| 1978 | 0 % | 4,7 % |
| 1977 | 0 % | 4 % |
| 1976 | 0 % | 3,8 % |
| 1975 | 0 % | 2 % |
| 1974 | 0 % | 1,7 % |
| 1973 | 0 % | 1,8 % |
| 1972 | 0 % | 1,8 % |
| 1971 | 0 % | 1,8 % |
| 1970 | 0 % | 1,9 % |
| 1969 | 0 % | 1,9 % |
| 1968 | 0 % | 1,7 % |
| 1967 | - | 1,4 % |
| 1966 | 0 % | 1,2 % |
| 1965 | - | 1,1 % |
| 1964 | 0 % | 1,2 % |
| 1963 | - | 1,7 % |
| 1962 | - | 2,7 % |
| 1961 | - | 2,1 % |
| 1960 | - | 1,6 % |
En 2025, el gasto militar fue del 1,4 % del PIB en la República Democrática del Congo y del 0,6 % en Argentina: 0,8 puntos porcentuales más en la República Democrática del Congo. En 2015 fue del 1,2 % en la República Democrática del Congo y del 0,9 % en Argentina, 0,3 puntos porcentuales más en la República Democrática del Congo.
El gasto militar de la República Democrática del Congo, como porcentaje del PIB, ha sido más alto que el de Argentina todos los años desde 2023. La diferencia fue máxima en 1978, cuando el gasto militar de Argentina superó al de la República Democrática del Congo en 4,7 puntos porcentuales del PIB.
República Democrática del Congo vs Argentina: datos del gasto militar
|
RDC
|
Argentina
|
|
|---|---|---|
| US$, 2025 | 1250 M US$ | 3850 M US$ |
| % del PIB, 2025 | 1,4 % | 0,6 % |
| Por persona, US$ | 11,1 US$ | 83,9 US$ |
| Porcentaje del mundo | 0,04 % | 0,13 % |
| Puesto mundial | 79/154 | 52/154 |
Comparar el gasto militar de 2 países cualesquiera
Fuentes:
- Banco Mundial | Sector público (1960–2025, actualizado en octubre de 2026)
Creative Commons Atribución (CC BY): puedes copiar, compartir, adaptar y reutilizar este contenido, también con fines comerciales, siempre que cites a statistics.wiki e indiques los cambios que hayas hecho. Las fuentes indicadas arriba pueden tener sus propias condiciones de licencia.