
Nepal vs Argentina: gasto militar (US$), 1960–2025
| Año | US$ | |
|---|---|---|
 Nepal |
 Argentina |
|
| 2025 | 439.315.331 US$ | 3.847.030.490 US$ |
| 2024 | 443.760.716 US$ | 4.179.838.658 US$ |
| 2023 | 461.493.437 US$ | 4.882.352.994 US$ |
| 2022 | 472.561.793 US$ | 4.340.235.091 US$ |
| 2021 | 448.938.111 US$ | 3.074.056.518 US$ |
| 2020 | 442.455.853 US$ | 2.831.765.795 US$ |
| 2019 | 422.476.702 US$ | 3.132.922.213 US$ |
| 2018 | 446.999.694 US$ | 3.843.257.896 US$ |
| 2017 | 430.221.486 US$ | 5.456.390.671 US$ |
| 2016 | 360.351.039 US$ | 4.511.804.451 US$ |
| 2015 | 333.287.680 US$ | 5.056.133.759 US$ |
| 2014 | 325.916.728 US$ | 4.621.617.919 US$ |
| 2013 | 297.134.416 US$ | 4.624.515.687 US$ |
| 2012 | 269.921.937 US$ | 4.285.004.735 US$ |
| 2011 | 291.392.439 US$ | 4.051.930.111 US$ |
| 2010 | 218.886.910 US$ | 3.452.047.165 US$ |
| 2009 | 185.028.874 US$ | 2.951.865.094 US$ |
| 2008 | 175.582.704 US$ | 2.757.807.340 US$ |
| 2007 | 139.765.675 US$ | 2.278.817.797 US$ |
| 2006 | 138.371.793 US$ | 1.833.095.114 US$ |
| 2005 | 137.200.726 US$ | 1.683.610.808 US$ |
| 2004 | 114.104.906 US$ | 1.454.415.858 US$ |
| 2003 | 88.172.128 US$ | 1.353.563.895 US$ |
| 2002 | 76.624.103 US$ | 1.067.029.325 US$ |
| 2001 | 57.713.815 US$ | 3.181.997.039 US$ |
| 2000 | 43.074.378 US$ | 3.264.997.128 US$ |
| 1999 | 38.857.001 US$ | 3.460.000.000 US$ |
| 1998 | 36.683.832 US$ | 3.397.002.841 US$ |
| 1997 | 35.297.909 US$ | 3.339.000.000 US$ |
| 1996 | 33.185.302 US$ | 3.377.996.897 US$ |
| 1995 | 33.763.124 US$ | 3.800.996.317 US$ |
| 1994 | 32.244.023 US$ | 3.751.000.000 US$ |
| 1993 | 30.564.647 US$ | 3.368.367.988 US$ |
| 1992 | 29.154.250 US$ | 3.251.456.838 US$ |
| 1991 | 34.069.585 US$ | 2.858.940.824 US$ |
| 1990 | 31.839.049 US$ | 2.050.898.683 US$ |
| 1989 | 31.785.041 US$ | 1.440.919.053 US$ |
| 1988 | 30.793.995 US$ | 2.696.340.375 US$ |
| 1987 | 34.279.972 US$ | 2.485.661.588 US$ |
| 1986 | 33.720.495 US$ | 2.449.546.586 US$ |
| 1985 | 31.329.643 US$ | 2.027.221.261 US$ |
| 1984 | 31.506.588 US$ | 2.527.749.192 US$ |
| 1983 | 30.661.264 US$ | 2.847.793.071 US$ |
| 1982 | 26.097.039 US$ | 2.280.144.825 US$ |
| 1981 | 22.575.000 US$ | 2.726.425.231 US$ |
| 1980 | 20.083.332 US$ | 2.385.017.949 US$ |
| 1979 | 16.868.696 US$ | 3.236.408.047 US$ |
| 1978 | 13.771.162 US$ | 4.202.371.974 US$ |
| 1977 | 12.332.986 US$ | 2.276.123.224 US$ |
| 1976 | 12.439.668 US$ | 1.934.867.782 US$ |
| 1975 | 10.749.606 US$ | 1.070.775.188 US$ |
| 1974 | 7.395.858 US$ | 1.201.859.183 US$ |
| 1973 | 6.393.328 US$ | 971.313.374 US$ |
| 1972 | 6.631.614 US$ | 633.463.772 US$ |
| 1971 | 5.454.701 US$ | 601.838.599 US$ |
| 1970 | 5.135.401 US$ | 593.081.284 US$ |
| 1969 | - | 605.590.513 US$ |
| 1968 | - | 445.649.879 US$ |
| 1967 | - | 339.593.346 US$ |
| 1966 | - | 334.403.945 US$ |
| 1965 | - | 303.288.354 US$ |
| 1964 | - | 294.460.368 US$ |
| 1963 | - | 306.971.678 US$ |
| 1962 | - | 487.782.584 US$ |
| 1961 | - | 430.829.516 US$ |
| 1960 | - | 245.914.852 US$ |
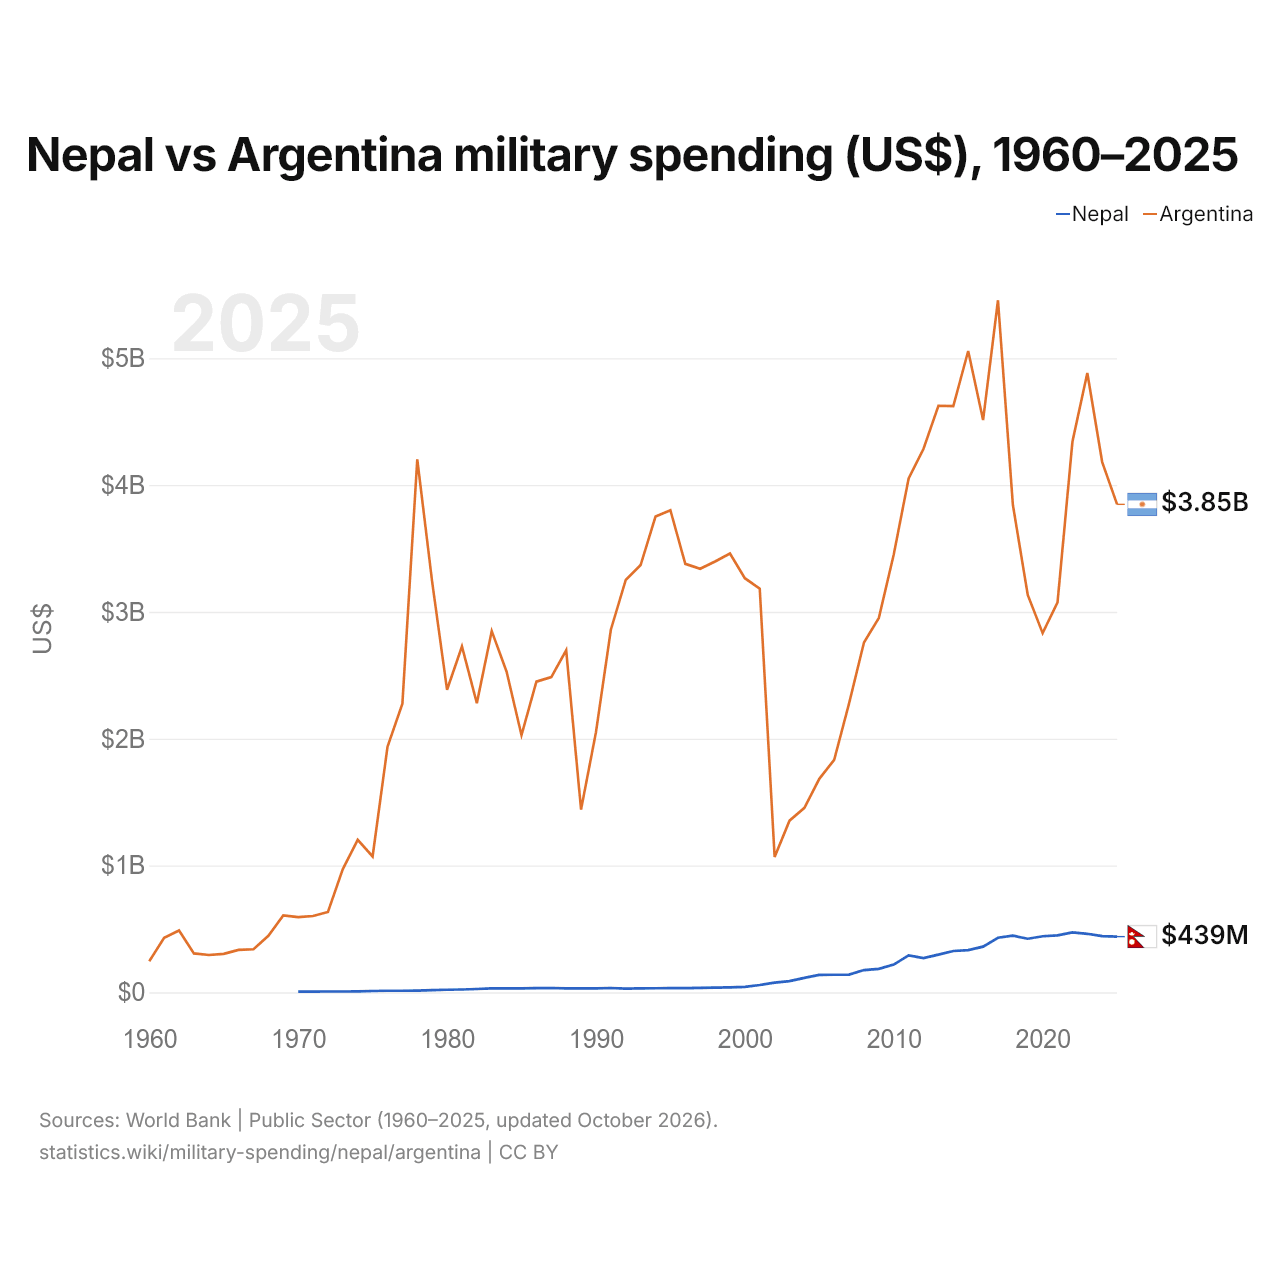
En 2025, el gasto militar fue de 439 millones de US$ en Nepal y de 3,85 mil millones de US$ en Argentina: 8,8 veces más en Argentina. En 1970 fue de 5,14 millones de US$ en Nepal y de 593 millones de US$ en Argentina, 120 veces más en Argentina.
Nepal vs Argentina: gasto militar en % del PIB, 1960–2025
| Año | % del PIB | |
|---|---|---|
|
Nepal
|
Argentina
|
|
| 2025 | 1 % | 0,6 % |
| 2024 | 1 % | 0,7 % |
| 2023 | 1,1 % | 0,8 % |
| 2022 | 1,1 % | 0,7 % |
| 2021 | 1,2 % | 0,6 % |
| 2020 | 1,3 % | 0,7 % |
| 2019 | 1,2 % | 0,7 % |
| 2018 | 1,3 % | 0,7 % |
| 2017 | 1,5 % | 0,8 % |
| 2016 | 1,5 % | 0,8 % |
| 2015 | 1,4 % | 0,9 % |
| 2014 | 1,4 % | 0,9 % |
| 2013 | 1,3 % | 0,8 % |
| 2012 | 1,2 % | 0,8 % |
| 2011 | 1,4 % | 0,8 % |
| 2010 | 1,4 % | 0,8 % |
| 2009 | 1,4 % | 0,9 % |
| 2008 | 1,4 % | 0,8 % |
| 2007 | 1,4 % | 0,8 % |
| 2006 | 1,5 % | 0,8 % |
| 2005 | 1,7 % | 0,8 % |
| 2004 | 1,6 % | 0,9 % |
| 2003 | 1,4 % | 1,1 % |
| 2002 | 1,3 % | 1,1 % |
| 2001 | 1 % | 1,2 % |
| 2000 | 0,8 % | 1,1 % |
| 1999 | 0,8 % | 1,2 % |
| 1998 | 0,8 % | 1,1 % |
| 1997 | 0,7 % | 1,1 % |
| 1996 | 0,7 % | 1,2 % |
| 1995 | 0,8 % | 1,5 % |
| 1994 | 0,8 % | 1,5 % |
| 1993 | 0,8 % | 1,4 % |
| 1992 | 0,9 % | 1,4 % |
| 1991 | 0,9 % | 1,5 % |
| 1990 | 0,9 % | 1,5 % |
| 1989 | 0,9 % | 1,9 % |
| 1988 | 0,9 % | 2,1 % |
| 1987 | 1,2 % | 2,3 % |
| 1986 | 1,2 % | 2,3 % |
| 1985 | 1,2 % | 2,3 % |
| 1984 | 1,2 % | 2,2 % |
| 1983 | 1,3 % | 2,7 % |
| 1982 | 1,1 % | 2,7 % |
| 1981 | 1 % | 3,5 % |
| 1980 | 1 % | 3,1 % |
| 1979 | 0,9 % | 4,7 % |
| 1978 | 0,9 % | 4,7 % |
| 1977 | 0,9 % | 4 % |
| 1976 | 0,9 % | 3,8 % |
| 1975 | 0,7 % | 2 % |
| 1974 | 0,6 % | 1,7 % |
| 1973 | 0,7 % | 1,8 % |
| 1972 | 0,6 % | 1,8 % |
| 1971 | 0,6 % | 1,8 % |
| 1970 | 0,6 % | 1,9 % |
| 1969 | - | 1,9 % |
| 1968 | - | 1,7 % |
| 1967 | - | 1,4 % |
| 1966 | - | 1,2 % |
| 1965 | - | 1,1 % |
| 1964 | - | 1,2 % |
| 1963 | - | 1,7 % |
| 1962 | - | 2,7 % |
| 1961 | - | 2,1 % |
| 1960 | - | 1,6 % |
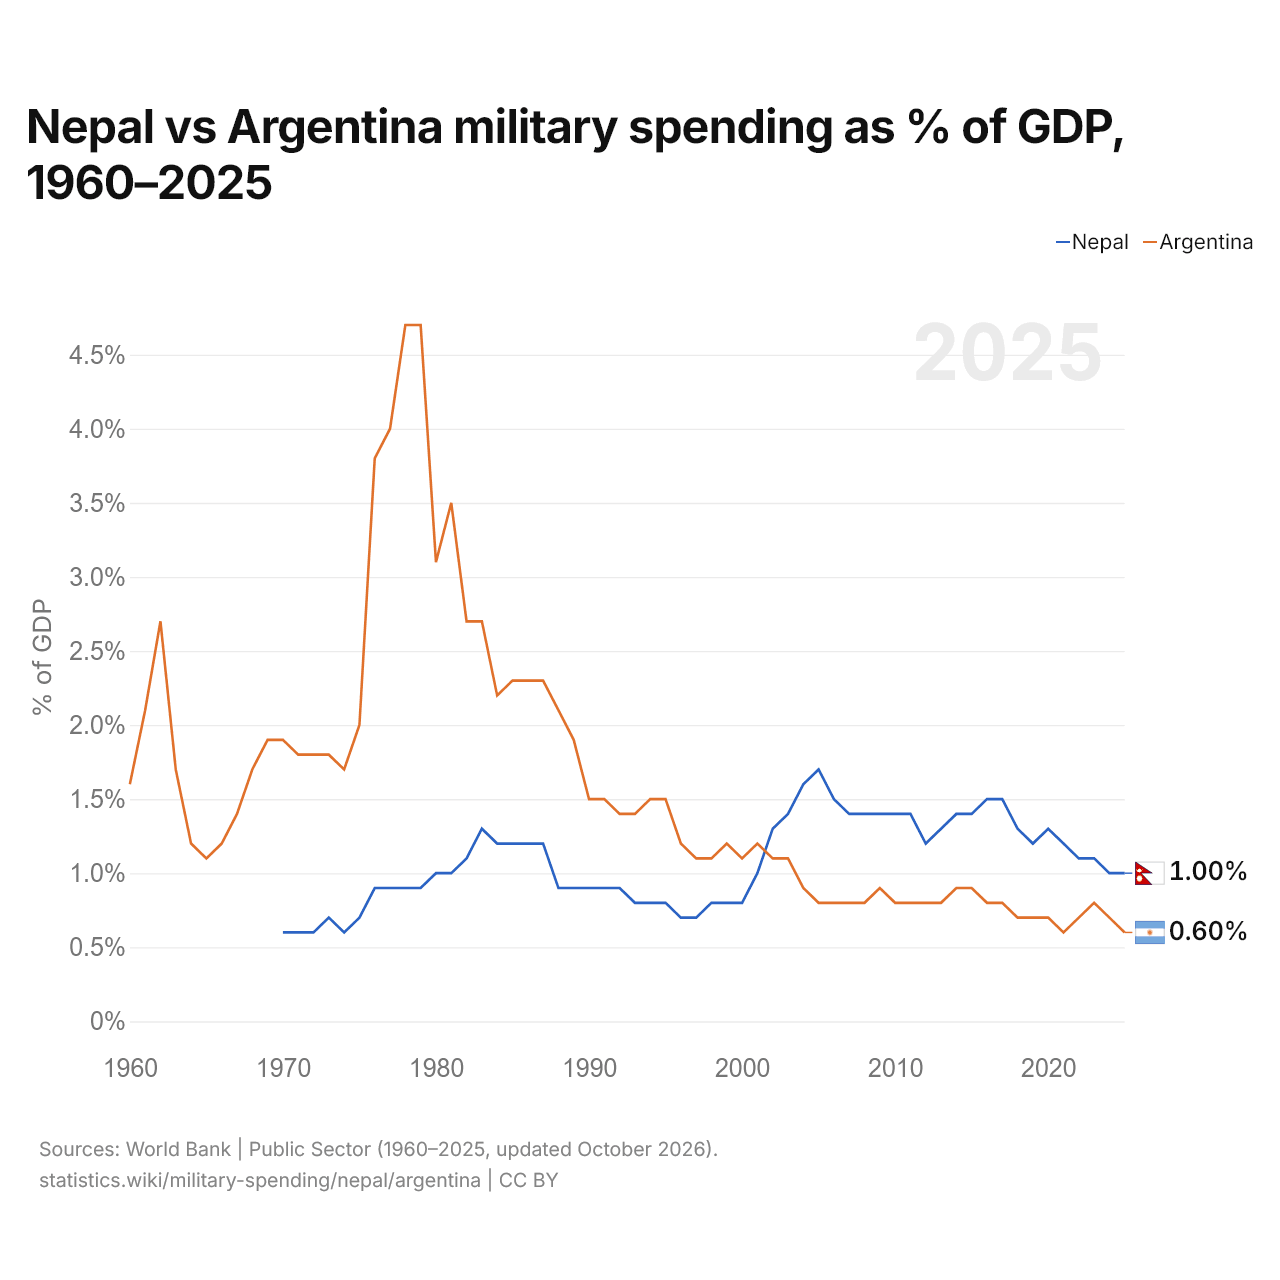
En 2025, el gasto militar fue del 1,0 % del PIB en Nepal y del 0,6 % en Argentina: 0,4 puntos porcentuales más en Nepal. En 2015 fue del 1,4 % en Nepal y del 0,9 % en Argentina, 0,5 puntos porcentuales más en Nepal.
El gasto militar de Nepal, como porcentaje del PIB, ha sido más alto que el de Argentina todos los años desde 2002. La diferencia fue máxima en 1978, cuando el gasto militar de Argentina superó al de Nepal en 3,8 puntos porcentuales del PIB.
Nepal vs Argentina: datos del gasto militar
|
Nepal
|
Argentina
|
|
|---|---|---|
| US$, 2025 | 439 M US$ | 3850 M US$ |
| % del PIB, 2025 | 1,0 % | 0,6 % |
| Por persona, US$ | 14,8 US$ | 83,9 US$ |
| Porcentaje del mundo | 0,02 % | 0,13 % |
| Puesto mundial | 108/154 | 52/154 |
Comparar el gasto militar de 2 países cualesquiera
Fuentes:
- Banco Mundial | Sector público (1960–2025, actualizado en octubre de 2026)
Creative Commons Atribución (CC BY): puedes copiar, compartir, adaptar y reutilizar este contenido, también con fines comerciales, siempre que cites a statistics.wiki e indiques los cambios que hayas hecho. Las fuentes indicadas arriba pueden tener sus propias condiciones de licencia.