
Gasto militar de Madagascar (US$), 1961–2025
| Año | Gasto militar | Puesto mundial |
|---|---|---|
| Madagascar | ||
| 2025 | 121.424.831 US$ | #134 |
| 2024 | 124.671.283 US$ | #131 |
| 2023 | 103.879.061 US$ | #136 |
| 2022 | 100.207.625 US$ | #134 |
| 2021 | 97.449.219 US$ | #128 |
| 2020 | 87.856.285 US$ | #131 |
| 2019 | 76.918.807 US$ | #138 |
| 2018 | 73.217.436 US$ | #139 |
| 2017 | 66.701.436 US$ | #136 |
| 2016 | 59.407.415 US$ | #137 |
| 2015 | 58.932.840 US$ | #138 |
| 2014 | 69.676.641 US$ | #138 |
| 2013 | 71.877.714 US$ | #137 |
| 2012 | 68.636.107 US$ | #137 |
| 2011 | 71.989.903 US$ | #132 |
| 2010 | 56.922.886 US$ | #135 |
| 2009 | 70.985.356 US$ | #132 |
| 2008 | 103.271.503 US$ | #125 |
| 2007 | 81.937.080 US$ | #125 |
| 2006 | 62.513.690 US$ | #124 |
| 2005 | 62.807.947 US$ | #122 |
| 2004 | 63.219.344 US$ | #123 |
| 2003 | 84.420.146 US$ | #108 |
| 2002 | 70.276.490 US$ | #107 |
| 2001 | 78.086.168 US$ | #103 |
| 2000 | 56.361.729 US$ | #109 |
| 1999 | 51.772.441 US$ | #113 |
| 1998 | 59.379.352 US$ | #109 |
| 1997 | 63.173.411 US$ | #110 |
| 1996 | 61.038.411 US$ | #107 |
| 1995 | 33.003.368 US$ | #122 |
| 1994 | 32.632.500 US$ | #117 |
| 1993 | 45.603.380 US$ | #109 |
| 1992 | 28.602.341 US$ | #112 |
| 1991 | 42.192.442 US$ | #102 |
| 1990 | 48.414.823 US$ | #97 |
| 1989 | 38.452.704 US$ | #98 |
| 1988 | 42.967.836 US$ | #93 |
| 1987 | 45.913.639 US$ | #94 |
| 1986 | 67.477.992 US$ | #81 |
| 1985 | 67.687.619 US$ | #79 |
| 1984 | 73.164.334 US$ | #79 |
| 1983 | - | - |
| 1982 | - | - |
| 1981 | 141.754.561 US$ | #68 |
| 1980 | 144.034.112 US$ | #64 |
| 1979 | 101.386.855 US$ | #68 |
| 1978 | 64.604.123 US$ | #71 |
| 1977 | 54.425.226 US$ | #70 |
| 1976 | 41.023.243 US$ | #72 |
| 1975 | 37.376.843 US$ | #72 |
| 1974 | 32.035.602 US$ | #71 |
| 1973 | 25.190.315 US$ | #68 |
| 1972 | 19.965.463 US$ | #70 |
| 1971 | 15.792.400 US$ | #68 |
| 1970 | 15.023.924 US$ | #68 |
| 1969 | 15.922.416 US$ | #60 |
| 1968 | 15.951.867 US$ | #61 |
| 1967 | 14.825.020 US$ | - |
| 1966 | 13.884.554 US$ | - |
| 1965 | 13.260.781 US$ | - |
| 1964 | 11.706.209 US$ | - |
| 1963 | 11.089.258 US$ | - |
| 1962 | 11.365.157 US$ | - |
| 1961 | 10.502.476 US$ | - |
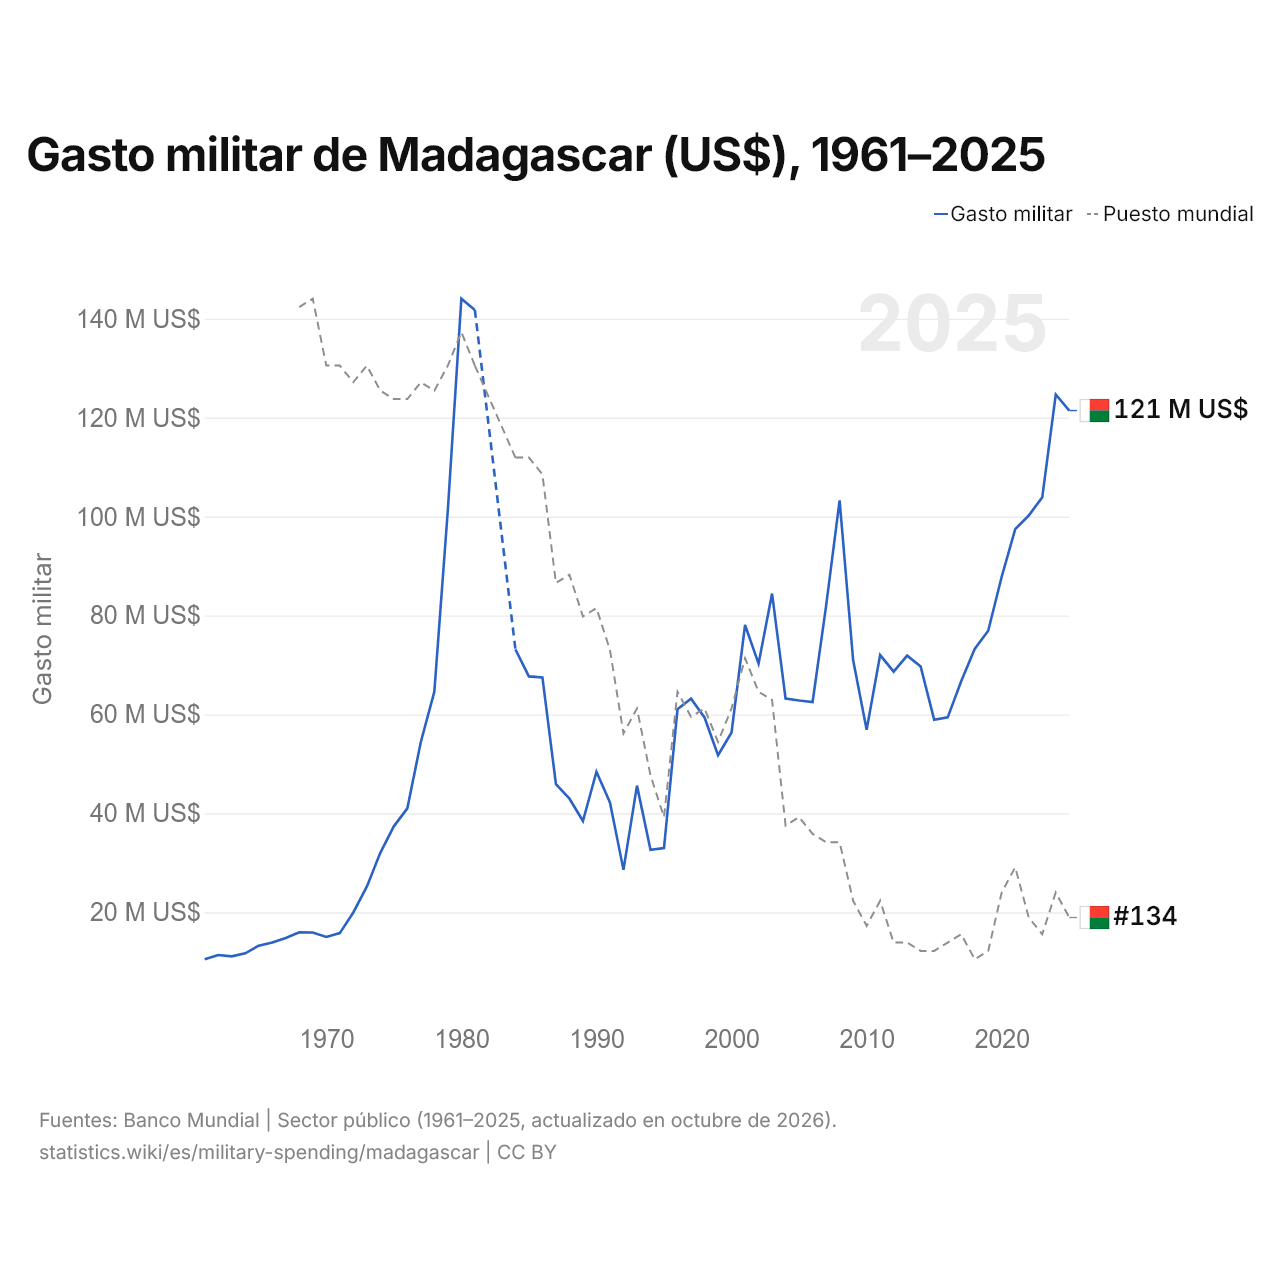
En 2025, el gasto militar de Madagascar fue de 121 millones de US$, frente a 10,5 millones de US$ en 1961. El de Madagascar equivalía a menos del 0,01 % del gasto militar mundial. Su máximo fue de 144 millones de US$, en 1980. Ocupó el puesto 134 del mundo; en 2024, el 131. Su mejor posición fue el puesto 60, por última vez en 1969.
El gasto militar de Madagascar fue el 37.º más alto de 49 países de África, y el 0,20 % del total de la región. Los efectivos de las fuerzas armadas de Madagascar son 22.000, el puesto 100 del mundo.
Gasto militar de Madagascar en % del PIB, 1961–2025
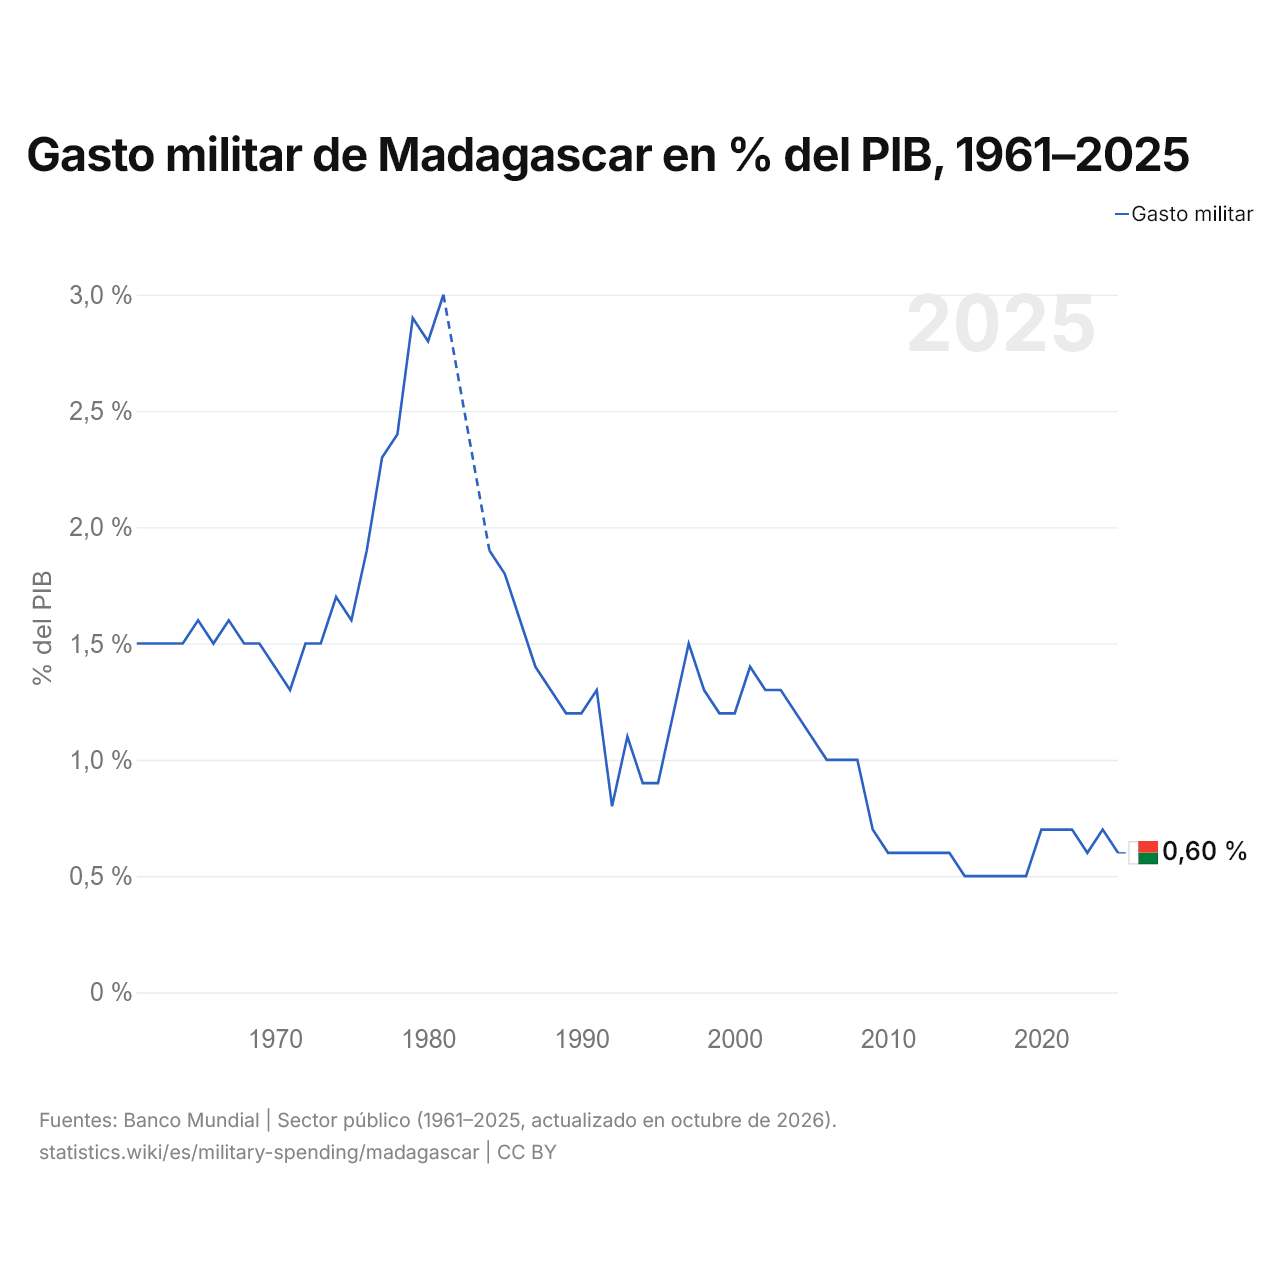
En 2025, el gasto militar de Madagascar fue del 0,6 % del PIB, frente al 1,5 % de 1961. Su máximo fue del 3,0 %, en 1981.
La mayor caída del gasto militar de Madagascar en diez años fue la de 1980 a 1990, de 1,6 puntos porcentuales del PIB; la mayor subida, la de 1970 a 1980, de 1,4 puntos.
Madagascar en la clasificación mundial del gasto militar, 2025
| Puesto | País | Gasto militar | % del PIB | US$ por persona | Porcentaje del mundo | |
|---|---|---|---|---|---|---|
| 131 |
 Malaui |
171 M US$ | 1,1 % | 7,69 US$ | 0,006 % | |
| 132 |
 Nicaragua |
126 M US$ | 0,6 % | 17,9 US$ | 0,004 % | |
| 133 |
 Malta |
125 M US$ | 0,4 % | 215 US$ | 0,004 % | |
| 134 |
 Madagascar |
121 M US$ | 0,6 % | 3,71 US$ | 0,004 % | |
| 135 |
 Guinea Ecuatorial |
115 M US$ | 0,9 % | 59,4 US$ | 0,004 % | |
| 136 |
 Moldavia |
114 M US$ | 0,6 % | 48,3 US$ | 0,004 % | |
| 137 |
 Papúa Nueva Guinea |
114 M US$ | 0,4 % | 10,6 US$ | 0,004 % |
Comparar el gasto militar de Madagascar con otros países
Fuentes:
- Banco Mundial | Sector público (1961–2025, actualizado en octubre de 2026)
Creative Commons Atribución (CC BY): puedes copiar, compartir, adaptar y reutilizar este contenido, también con fines comerciales, siempre que cites a statistics.wiki e indiques los cambios que hayas hecho. Las fuentes indicadas arriba pueden tener sus propias condiciones de licencia.