
Gasto militar de Hungría (US$), 1970–2025
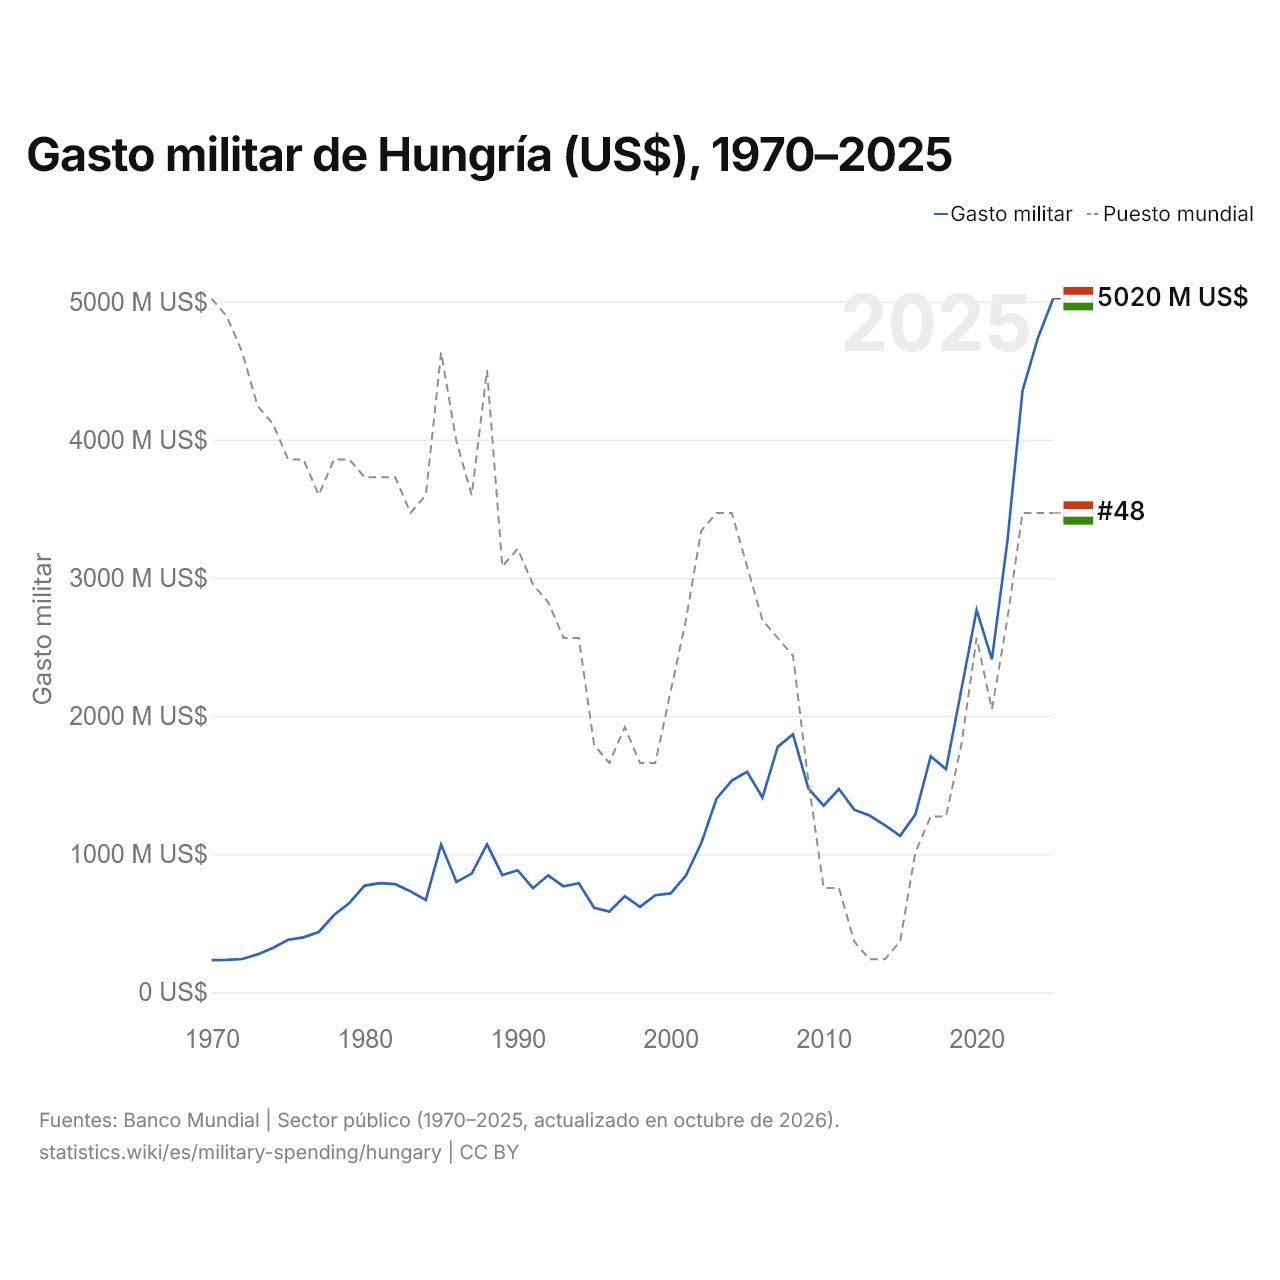
| Año | Gasto militar | Puesto mundial |
|---|---|---|
| Hungría | ||
| 2025 | 5.020.515.189 US$ | #48 |
| 2024 | 4.735.347.022 US$ | #48 |
| 2023 | 4.354.113.454 US$ | #48 |
| 2022 | 3.255.307.471 US$ | #54 |
| 2021 | 2.410.401.106 US$ | #59 |
| 2020 | 2.767.305.923 US$ | #55 |
| 2019 | 2.190.070.873 US$ | #61 |
| 2018 | 1.615.400.273 US$ | #65 |
| 2017 | 1.708.119.762 US$ | #65 |
| 2016 | 1.288.696.023 US$ | #67 |
| 2015 | 1.132.478.319 US$ | #72 |
| 2014 | 1.209.801.890 US$ | #73 |
| 2013 | 1.280.050.962 US$ | #73 |
| 2012 | 1.322.276.724 US$ | #72 |
| 2011 | 1.472.069.832 US$ | #69 |
| 2010 | 1.350.819.331 US$ | #69 |
| 2009 | 1.475.820.357 US$ | #63 |
| 2008 | 1.867.874.243 US$ | #56 |
| 2007 | 1.776.466.052 US$ | #55 |
| 2006 | 1.410.071.771 US$ | #54 |
| 2005 | 1.596.091.842 US$ | #51 |
| 2004 | 1.532.613.746 US$ | #48 |
| 2003 | 1.401.563.128 US$ | #48 |
| 2002 | 1.079.254.008 US$ | #49 |
| 2001 | 845.063.048 US$ | #54 |
| 2000 | 715.857.157 US$ | #58 |
| 1999 | 702.943.084 US$ | #62 |
| 1998 | 618.465.245 US$ | #62 |
| 1997 | 695.971.716 US$ | #60 |
| 1996 | 585.273.052 US$ | #62 |
| 1995 | 612.010.974 US$ | #61 |
| 1994 | 789.995.205 US$ | #55 |
| 1993 | 767.512.580 US$ | #55 |
| 1992 | 846.955.225 US$ | #53 |
| 1991 | 753.646.318 US$ | #52 |
| 1990 | 883.865.887 US$ | #50 |
| 1989 | 847.620.402 US$ | #51 |
| 1988 | 1.071.668.730 US$ | #40 |
| 1987 | 859.327.332 US$ | #47 |
| 1986 | 798.781.732 US$ | #44 |
| 1985 | 1.069.601.518 US$ | #39 |
| 1984 | 668.651.987 US$ | #47 |
| 1983 | 730.915.900 US$ | #48 |
| 1982 | 782.988.380 US$ | #46 |
| 1981 | 790.297.450 US$ | #46 |
| 1980 | 772.703.397 US$ | #46 |
| 1979 | 646.504.561 US$ | #45 |
| 1978 | 560.027.919 US$ | #45 |
| 1977 | 436.905.831 US$ | #47 |
| 1976 | 397.894.180 US$ | #45 |
| 1975 | 380.916.344 US$ | #45 |
| 1974 | 321.308.242 US$ | #43 |
| 1973 | 274.787.813 US$ | #42 |
| 1972 | 241.573.442 US$ | #39 |
| 1971 | 235.410.673 US$ | #37 |
| 1970 | 232.975.793 US$ | #36 |
En 2025, el gasto militar de Hungría fue de 5,02 mil millones de US$, frente a 233 millones de US$ en 1970. El de Hungría equivalía al 0,18 % del gasto militar mundial. Ocupó el puesto 48 del mundo, que mantiene desde 2023. Su mejor posición fue el puesto 36, por última vez en 1970.
El gasto militar de Hungría fue el 21.º más alto de 40 países de Europa, y el 0,58 % del total de la región. Los efectivos de las fuerzas armadas de Hungría son 46.000, el puesto 73 del mundo.
Gasto militar de Hungría en % del PIB, 1970–2025
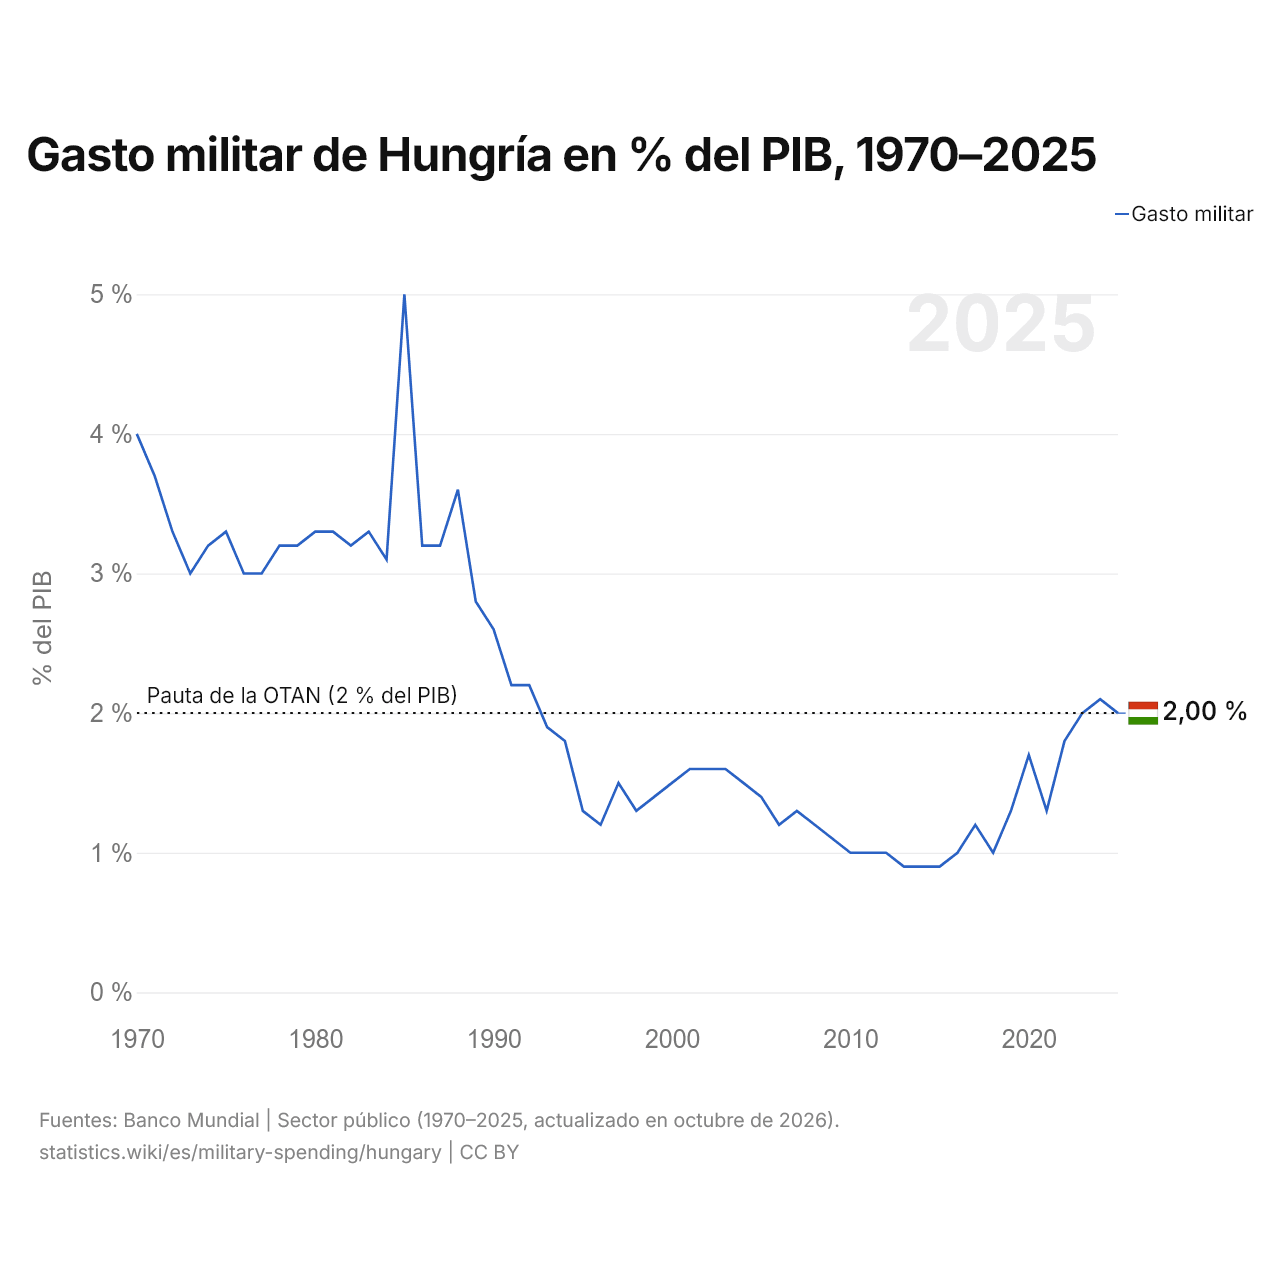
En 2025, el gasto militar de Hungría fue del 2,0 % del PIB, frente al 4,0 % de 1970. Su máximo fue del 5,0 %, en 1985. El gasto de Hungría alcanzaba el 2 % del PIB que los miembros de la OTAN acordaron gastar.
La mayor caída del gasto militar de Hungría en diez años fue la de 1990 a 2000, de 1,1 puntos porcentuales del PIB; la mayor subida, la de 2010 a 2020, de 0,7 puntos. El gasto militar de Hungría fue del 2 % del PIB o más en 26 de los años de 1970 a 2025, y todos los años de 2023 a 2025.
Hungría en la clasificación mundial del gasto militar, 2025
| Puesto | País | Gasto militar | % del PIB | US$ por persona | Porcentaje del mundo | |
|---|---|---|---|---|---|---|
| 45 |
 Tailandia |
5990 M US$ | 1,0 % | 83,6 US$ | 0,21 % | |
| 46 |
 Portugal |
5930 M US$ | 1,7 % | 549 US$ | 0,21 % | vs Portugal |
| 47 |
 Chile |
5430 M US$ | 1,5 % | 273,6 US$ | 0,19 % | vs Chile |
| 48 |
 Hungría |
5020 M US$ | 2,0 % | 528 US$ | 0,18 % | |
| 49 |
 Azerbaiyán |
4910 M US$ | 6,5 % | 479 US$ | 0,17 % | |
| 50 |
 Birmania |
4890 M US$ (2024) | 6,6 % | 89,8 US$ | 0,18 % | |
| 51 |
 Malasia |
4890 M US$ | 1,0 % | 136 US$ | 0,17 % |
Comparar el gasto militar de Hungría con otros países
Fuentes:
- Banco Mundial | Sector público (1970–2025, actualizado en octubre de 2026)
Creative Commons Atribución (CC BY): puedes copiar, compartir, adaptar y reutilizar este contenido, también con fines comerciales, siempre que cites a statistics.wiki e indiques los cambios que hayas hecho. Las fuentes indicadas arriba pueden tener sus propias condiciones de licencia.