
Gasto militar de Nepal (US$), 1970–2025
| Año | Gasto militar | Puesto mundial |
|---|---|---|
| Nepal | ||
| 2025 | 439.315.331 US$ | #108 |
| 2024 | 443.760.716 US$ | #107 |
| 2023 | 461.493.437 US$ | #99 |
| 2022 | 472.561.793 US$ | #94 |
| 2021 | 448.938.111 US$ | #95 |
| 2020 | 442.455.853 US$ | #93 |
| 2019 | 422.476.702 US$ | #97 |
| 2018 | 446.999.694 US$ | #96 |
| 2017 | 430.221.486 US$ | #96 |
| 2016 | 360.351.039 US$ | #99 |
| 2015 | 333.287.680 US$ | #102 |
| 2014 | 325.916.728 US$ | #104 |
| 2013 | 297.134.416 US$ | #105 |
| 2012 | 269.921.937 US$ | #106 |
| 2011 | 291.392.439 US$ | #103 |
| 2010 | 218.886.910 US$ | #105 |
| 2009 | 185.028.874 US$ | #109 |
| 2008 | 175.582.704 US$ | #110 |
| 2007 | 139.765.675 US$ | #111 |
| 2006 | 138.371.793 US$ | #107 |
| 2005 | 137.200.726 US$ | #103 |
| 2004 | 114.104.906 US$ | #105 |
| 2003 | 88.172.128 US$ | #106 |
| 2002 | 76.624.103 US$ | #105 |
| 2001 | 57.713.815 US$ | #112 |
| 2000 | 43.074.378 US$ | #117 |
| 1999 | 38.857.001 US$ | #120 |
| 1998 | 36.683.832 US$ | #121 |
| 1997 | 35.297.909 US$ | #125 |
| 1996 | 33.185.302 US$ | #128 |
| 1995 | 33.763.124 US$ | #120 |
| 1994 | 32.244.023 US$ | #118 |
| 1993 | 30.564.647 US$ | #118 |
| 1992 | 29.154.250 US$ | #111 |
| 1991 | 34.069.585 US$ | #105 |
| 1990 | 31.839.049 US$ | #102 |
| 1989 | 31.785.041 US$ | #100 |
| 1988 | 30.793.995 US$ | #99 |
| 1987 | 34.279.972 US$ | #97 |
| 1986 | 33.720.495 US$ | #96 |
| 1985 | 31.329.643 US$ | #92 |
| 1984 | 31.506.588 US$ | #88 |
| 1983 | 30.661.264 US$ | #90 |
| 1982 | 26.097.039 US$ | #93 |
| 1981 | 22.575.000 US$ | #96 |
| 1980 | 20.083.332 US$ | #97 |
| 1979 | 16.868.696 US$ | #94 |
| 1978 | 13.771.162 US$ | #92 |
| 1977 | 12.332.986 US$ | #91 |
| 1976 | 12.439.668 US$ | #88 |
| 1975 | 10.749.606 US$ | #85 |
| 1974 | 7.395.858 US$ | #88 |
| 1973 | 6.393.328 US$ | #84 |
| 1972 | 6.631.614 US$ | #81 |
| 1971 | 5.454.701 US$ | #81 |
| 1970 | 5.135.401 US$ | #78 |
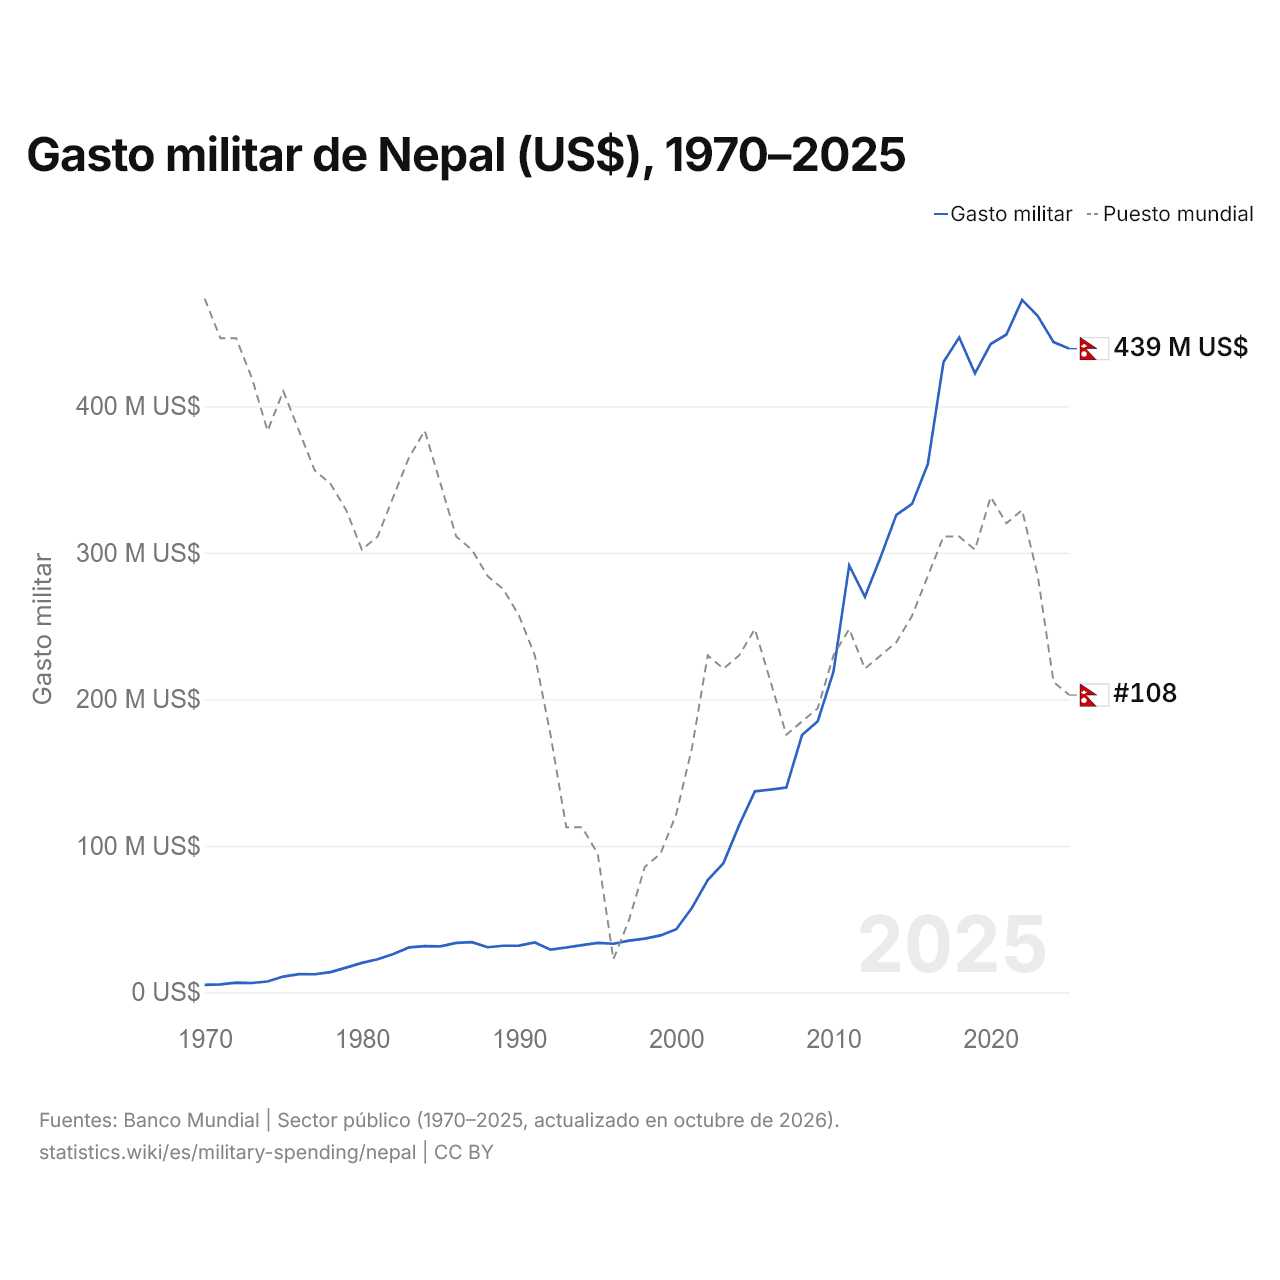
En 2025, el gasto militar de Nepal fue de 439 millones de US$, frente a 5,14 millones de US$ en 1970. El de Nepal equivalía al 0,015 % del gasto militar mundial. Su máximo fue de 473 millones de US$, en 2022. Ocupó el puesto 108 del mundo; en 2024, el 107. Su mejor posición fue el puesto 78, por última vez en 1970.
El gasto militar de Nepal fue el 33.º más alto de 37 países de Asia, y el 0,054 % del total de la región. Los efectivos de las fuerzas armadas de Nepal son 112.000, el puesto 52 del mundo.
Gasto militar de Nepal en % del PIB, 1970–2025
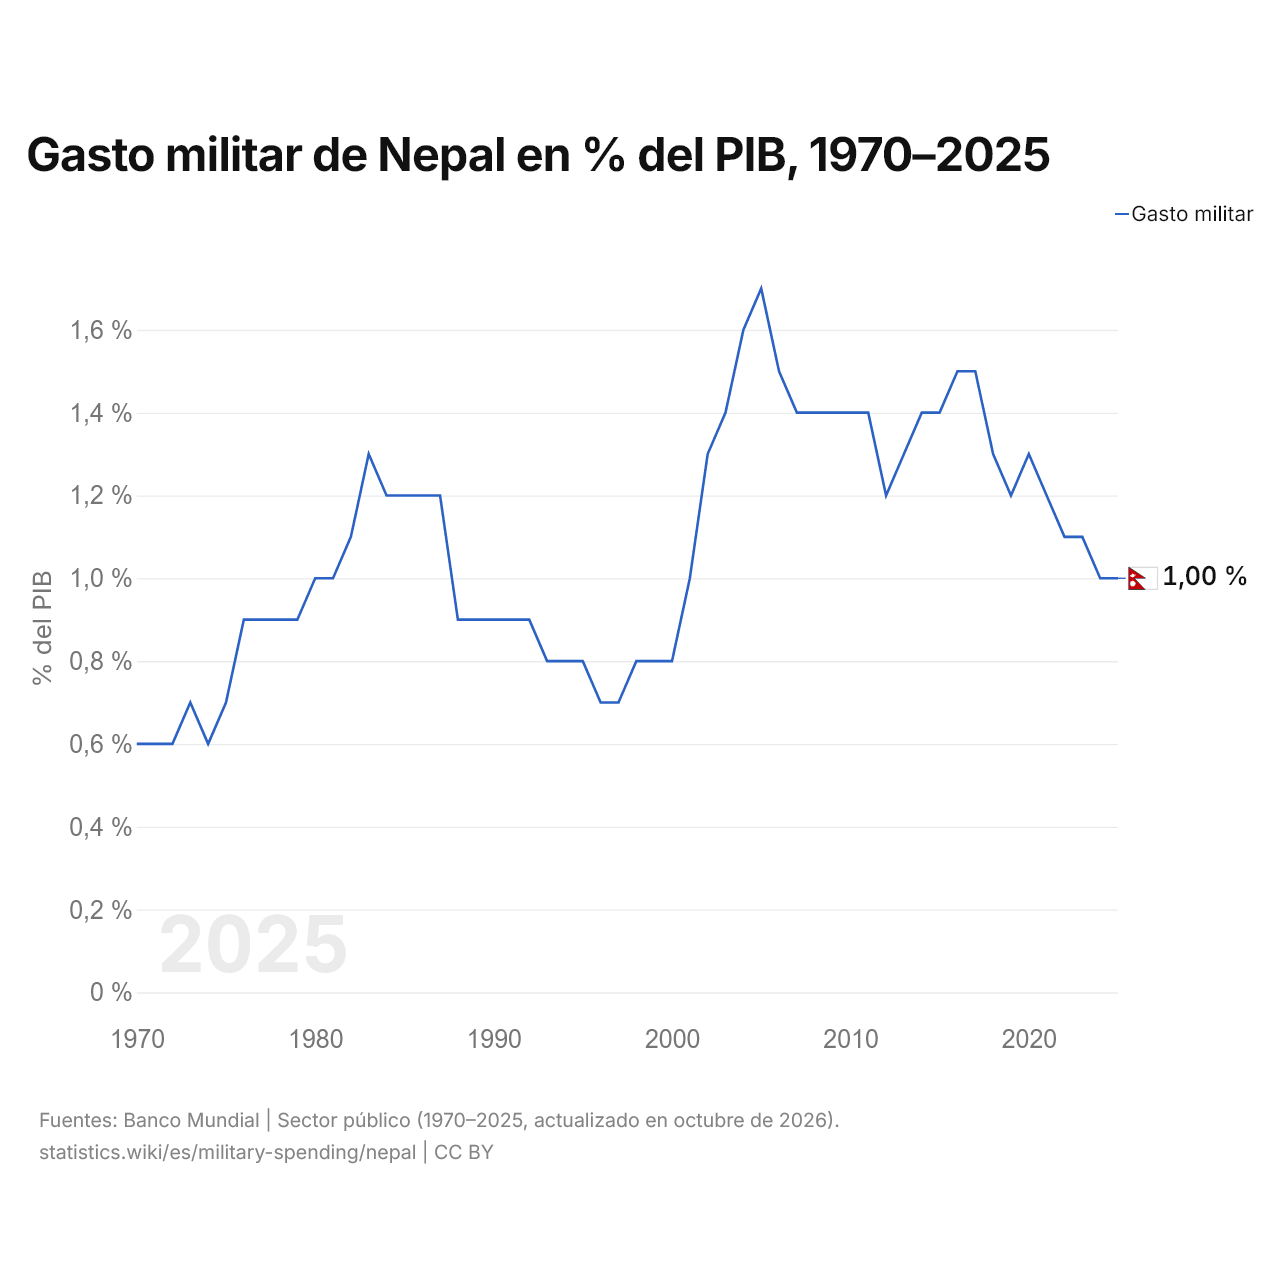
En 2025, el gasto militar de Nepal fue del 1,0 % del PIB, frente al 0,6 % de 1970. Su máximo fue del 1,7 %, en 2005.
La mayor subida del gasto militar de Nepal en diez años fue la de 2000 a 2010, de 0,6 puntos porcentuales del PIB.
Nepal en la clasificación mundial del gasto militar, 2025
| Puesto | País | Gasto militar | % del PIB | US$ por persona | Porcentaje del mundo | |
|---|---|---|---|---|---|---|
| 105 |
 Venezuela |
513 M US$ (2023) | 0,5 % | 18,1 US$ | 0,02 % | vs Venezuela |
| 106 |
 El Salvador |
492 M US$ | 1,3 % | 77,2 US$ | 0,02 % | |
| 107 |
 Níger |
462 M US$ | 2,1 % | 16,6 US$ | 0,02 % | |
| 108 |
 Nepal |
439 M US$ | 1,0 % | 14,8 US$ | 0,02 % | |
| 109 |
 Paraguay |
431 M US$ | 0,9 % | 61,5 US$ | 0,02 % | |
| 110 |
 Namibia |
417 M US$ | 2,8 % | 134,9 US$ | 0,01 % | |
| 111 |
 Mozambique |
417 M US$ | 1,9 % | 11,7 US$ | 0,01 % |
Comparar el gasto militar de Nepal con otros países
Fuentes:
- Banco Mundial | Sector público (1970–2025, actualizado en octubre de 2026)
Creative Commons Atribución (CC BY): puedes copiar, compartir, adaptar y reutilizar este contenido, también con fines comerciales, siempre que cites a statistics.wiki e indiques los cambios que hayas hecho. Las fuentes indicadas arriba pueden tener sus propias condiciones de licencia.