
Gasto militar de Senegal (US$), 1979–2025
| Año | Gasto militar | Puesto mundial |
|---|---|---|
| Senegal | ||
| 2025 | 575.613.175 US$ | #101 |
| 2024 | 632.278.010 US$ | #90 |
| 2023 | 453.249.209 US$ | #100 |
| 2022 | 423.449.478 US$ | #101 |
| 2021 | 483.313.209 US$ | #92 |
| 2020 | 345.567.818 US$ | #100 |
| 2019 | 356.849.411 US$ | #103 |
| 2018 | 385.338.671 US$ | #100 |
| 2017 | 308.409.280 US$ | #106 |
| 2016 | 305.044.359 US$ | #104 |
| 2015 | 214.914.557 US$ | #114 |
| 2014 | 240.213.143 US$ | #113 |
| 2013 | 236.805.202 US$ | #114 |
| 2012 | 196.650.188 US$ | #117 |
| 2011 | 230.491.919 US$ | #107 |
| 2010 | 195.923.857 US$ | #110 |
| 2009 | 215.688.749 US$ | #104 |
| 2008 | 217.747.962 US$ | #102 |
| 2007 | 193.063.080 US$ | #103 |
| 2006 | 148.687.194 US$ | #103 |
| 2005 | 124.453.218 US$ | #106 |
| 2004 | 106.595.073 US$ | #110 |
| 2003 | 97.810.071 US$ | #105 |
| 2002 | 77.157.335 US$ | #104 |
| 2001 | 72.605.686 US$ | #106 |
| 2000 | 63.039.843 US$ | #108 |
| 1999 | 79.254.236 US$ | #103 |
| 1998 | 76.710.346 US$ | #105 |
| 1997 | 72.311.198 US$ | #106 |
| 1996 | 81.597.436 US$ | #100 |
| 1995 | 82.881.359 US$ | #98 |
| 1994 | 67.847.104 US$ | #98 |
| 1993 | 122.920.412 US$ | #85 |
| 1992 | 112.196.164 US$ | #87 |
| 1991 | 112.242.137 US$ | #82 |
| 1990 | 120.729.160 US$ | #82 |
| 1989 | 129.083.941 US$ | #77 |
| 1988 | 135.543.187 US$ | #77 |
| 1987 | 128.526.669 US$ | #76 |
| 1986 | 110.000.936 US$ | #75 |
| 1985 | 83.744.211 US$ | #76 |
| 1984 | 83.921.132 US$ | #75 |
| 1983 | 90.871.687 US$ | #73 |
| 1982 | 94.308.221 US$ | #74 |
| 1981 | 111.998.700 US$ | #71 |
| 1980 | 124.265.673 US$ | #67 |
| 1979 | 140.157.659 US$ | #63 |
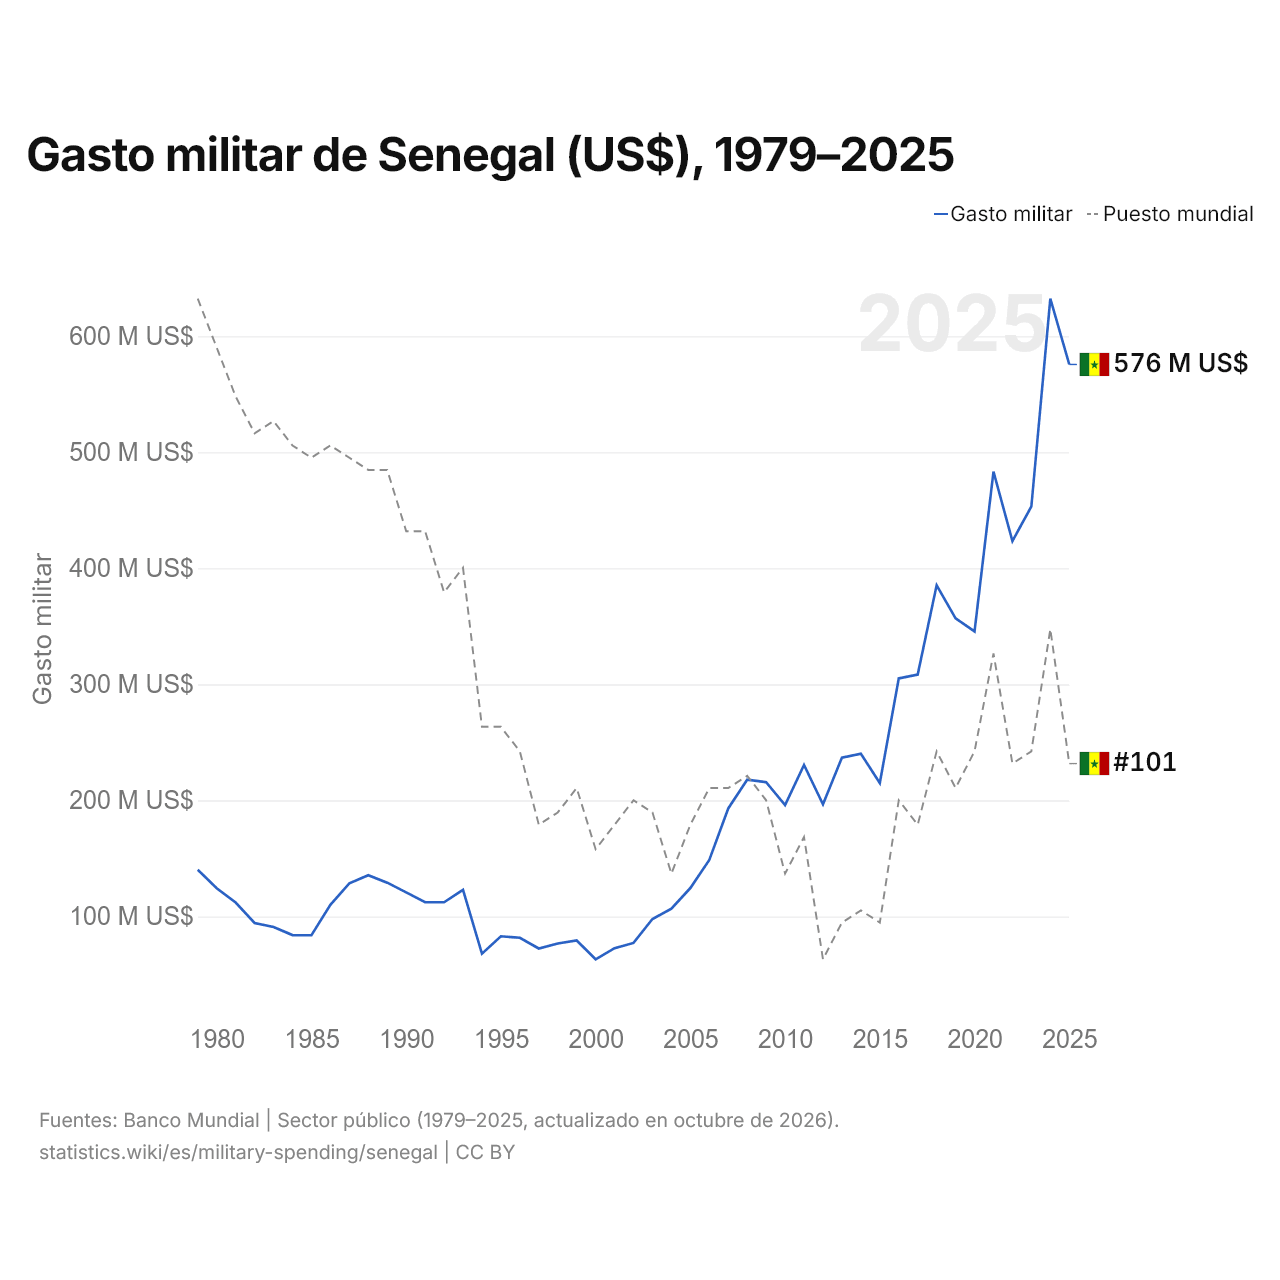
En 2025, el gasto militar de Senegal fue de 576 millones de US$, frente a 140 millones de US$ en 1979. El de Senegal equivalía al 0,020 % del gasto militar mundial. Su máximo fue de 632 millones de US$, en 2024. Ocupó el puesto 101 del mundo; en 2024, el 90. Su mejor posición fue el puesto 63, por última vez en 1979.
El gasto militar de Senegal fue el 20.º más alto de 49 países de África, y el 0,97 % del total de la región. Los efectivos de las fuerzas armadas de Senegal son 19.000, el puesto 108 del mundo.
Gasto militar de Senegal en % del PIB, 1979–2025
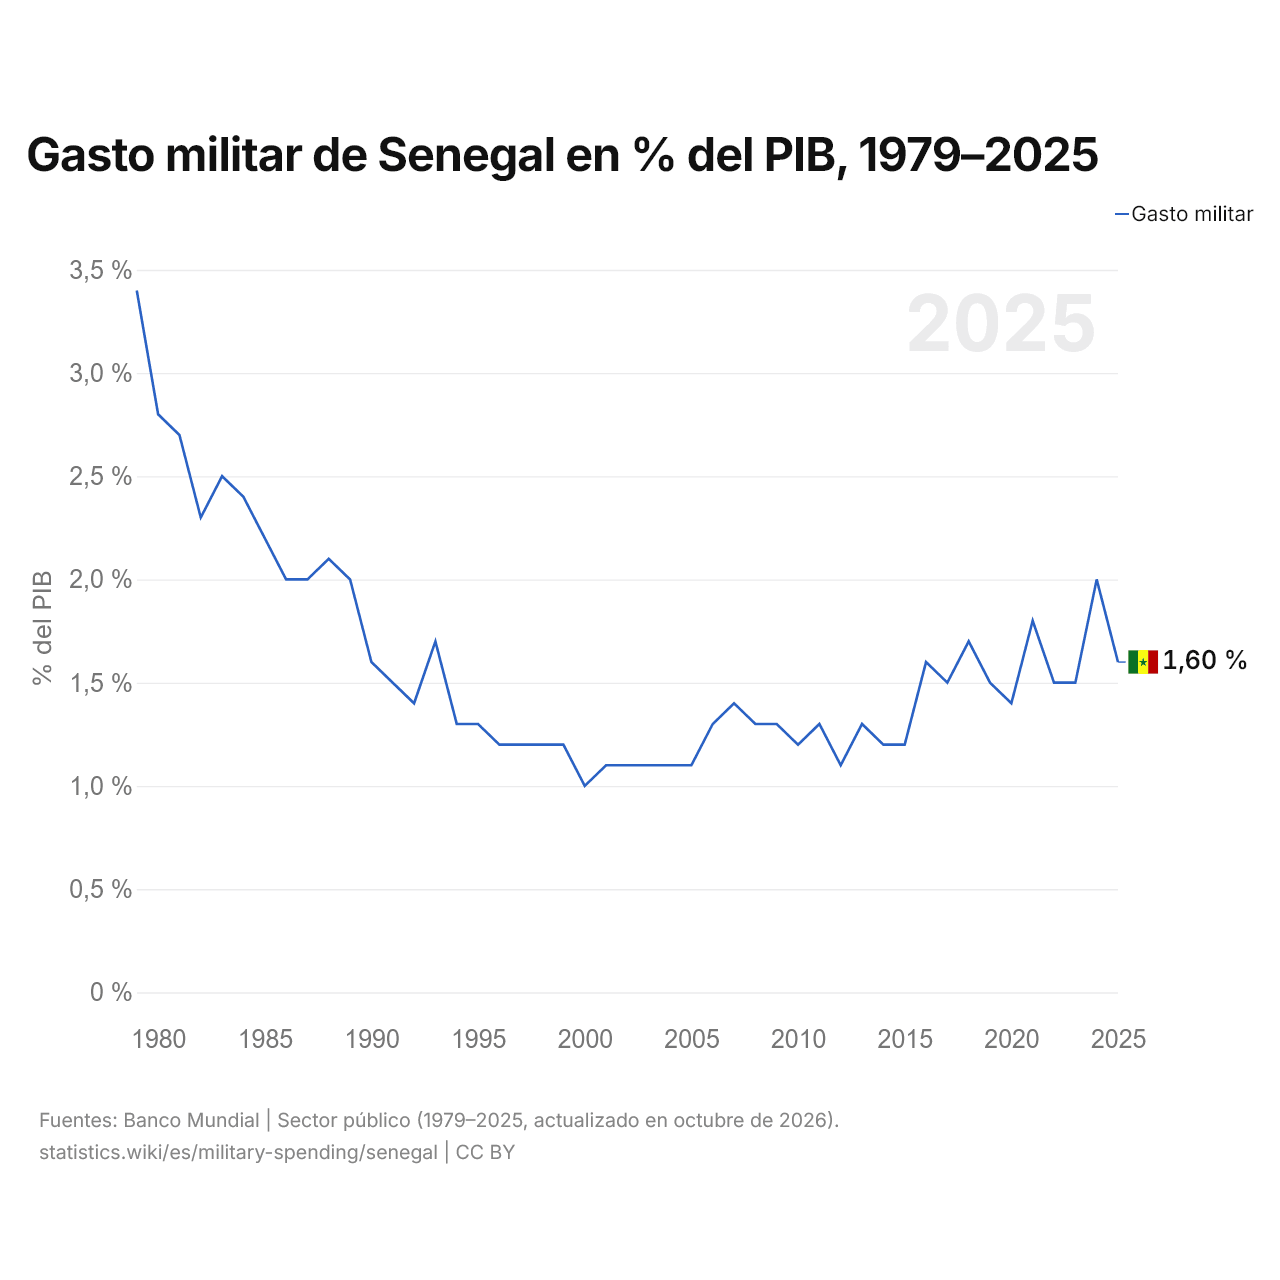
En 2025, el gasto militar de Senegal fue del 1,6 % del PIB, frente al 3,4 % de 1979. Su mínimo fue del 1,0 %, en 2000.
La mayor caída del gasto militar de Senegal en diez años fue la de 1980 a 1990, de 1,2 puntos porcentuales del PIB.
Senegal en la clasificación mundial del gasto militar, 2025
| Puesto | País | Gasto militar | % del PIB | US$ por persona | Porcentaje del mundo | |
|---|---|---|---|---|---|---|
| 98 |
 Botsuana |
619 M US$ | 3,1 % | 241,7 US$ | 0,02 % | |
| 99 |
 Líbano |
585 M US$ (2024) | 2,3 % | 100,7 US$ | 0,02 % | |
| 100 |
 Honduras |
580 M US$ | 1,5 % | 52,7 US$ | 0,02 % | |
| 101 |
 Senegal |
576 M US$ | 1,6 % | 30,4 US$ | 0,02 % | |
| 102 |
 Guinea |
575 M US$ | 2,0 % | 38,1 US$ | 0,02 % | vs Guinea |
| 103 |
 Brunéi |
560 M US$ (2024) | 3,7 % | 1211 US$ | 0,02 % | |
| 104 |
 Ghana |
545 M US$ | 0,5 % | 15,5 US$ | 0,02 % | vs Ghana |
Comparar el gasto militar de Senegal con otros países
Fuentes:
- Banco Mundial | Sector público (1979–2025, actualizado en octubre de 2026)
Creative Commons Atribución (CC BY): puedes copiar, compartir, adaptar y reutilizar este contenido, también con fines comerciales, siempre que cites a statistics.wiki e indiques los cambios que hayas hecho. Las fuentes indicadas arriba pueden tener sus propias condiciones de licencia.