
Gasto militar de Camerún (US$), 1970–2025
| Año | Gasto militar | Puesto mundial |
|---|---|---|
| Camerún | ||
| 2025 | 623.684.918 US$ | #96 |
| 2024 | 534.905.985 US$ | #100 |
| 2023 | 452.261.705 US$ | #101 |
| 2022 | 416.576.787 US$ | #103 |
| 2021 | 443.461.562 US$ | #96 |
| 2020 | 393.220.124 US$ | #95 |
| 2019 | 422.294.370 US$ | #98 |
| 2018 | 429.925.664 US$ | #97 |
| 2017 | 410.936.410 US$ | #97 |
| 2016 | 387.655.794 US$ | #97 |
| 2015 | 353.957.814 US$ | #101 |
| 2014 | 402.063.905 US$ | #97 |
| 2013 | 392.952.314 US$ | #92 |
| 2012 | 354.427.096 US$ | #97 |
| 2011 | 347.933.110 US$ | #96 |
| 2010 | 354.399.825 US$ | #94 |
| 2009 | 344.646.538 US$ | #95 |
| 2008 | 347.988.757 US$ | #94 |
| 2007 | 297.091.481 US$ | #91 |
| 2006 | 257.156.222 US$ | #90 |
| 2005 | 223.173.321 US$ | #90 |
| 2004 | 263.868.939 US$ | #83 |
| 2003 | 220.998.337 US$ | #83 |
| 2002 | 166.205.748 US$ | #87 |
| 2001 | 141.339.397 US$ | #90 |
| 2000 | 139.980.639 US$ | #89 |
| 1999 | 166.993.462 US$ | #85 |
| 1998 | 157.779.661 US$ | #88 |
| 1997 | 140.396.937 US$ | #86 |
| 1996 | 135.877.866 US$ | #88 |
| 1995 | 135.988.364 US$ | #86 |
| 1994 | 116.652.322 US$ | #88 |
| 1993 | 214.591.018 US$ | #79 |
| 1992 | 185.012.706 US$ | #76 |
| 1991 | 179.325.834 US$ | #74 |
| 1990 | 181.585.249 US$ | #72 |
| 1989 | 146.873.401 US$ | #73 |
| 1988 | 157.208.395 US$ | #72 |
| 1987 | 163.124.077 US$ | #72 |
| 1986 | 144.398.012 US$ | #68 |
| 1985 | 114.486.424 US$ | #69 |
| 1984 | 127.243.742 US$ | #70 |
| 1983 | 129.893.778 US$ | #68 |
| 1982 | 131.598.316 US$ | #68 |
| 1981 | 120.247.394 US$ | #70 |
| 1980 | 103.844.128 US$ | #70 |
| 1979 | 97.981.030 US$ | #69 |
| 1978 | 77.641.962 US$ | #67 |
| 1977 | 58.247.346 US$ | #68 |
| 1976 | 51.073.765 US$ | #68 |
| 1975 | 49.358.004 US$ | #66 |
| 1974 | 36.502.192 US$ | #69 |
| 1973 | 33.477.342 US$ | #66 |
| 1972 | 26.412.004 US$ | #67 |
| 1971 | 22.792.753 US$ | #64 |
| 1970 | 21.552.254 US$ | #62 |
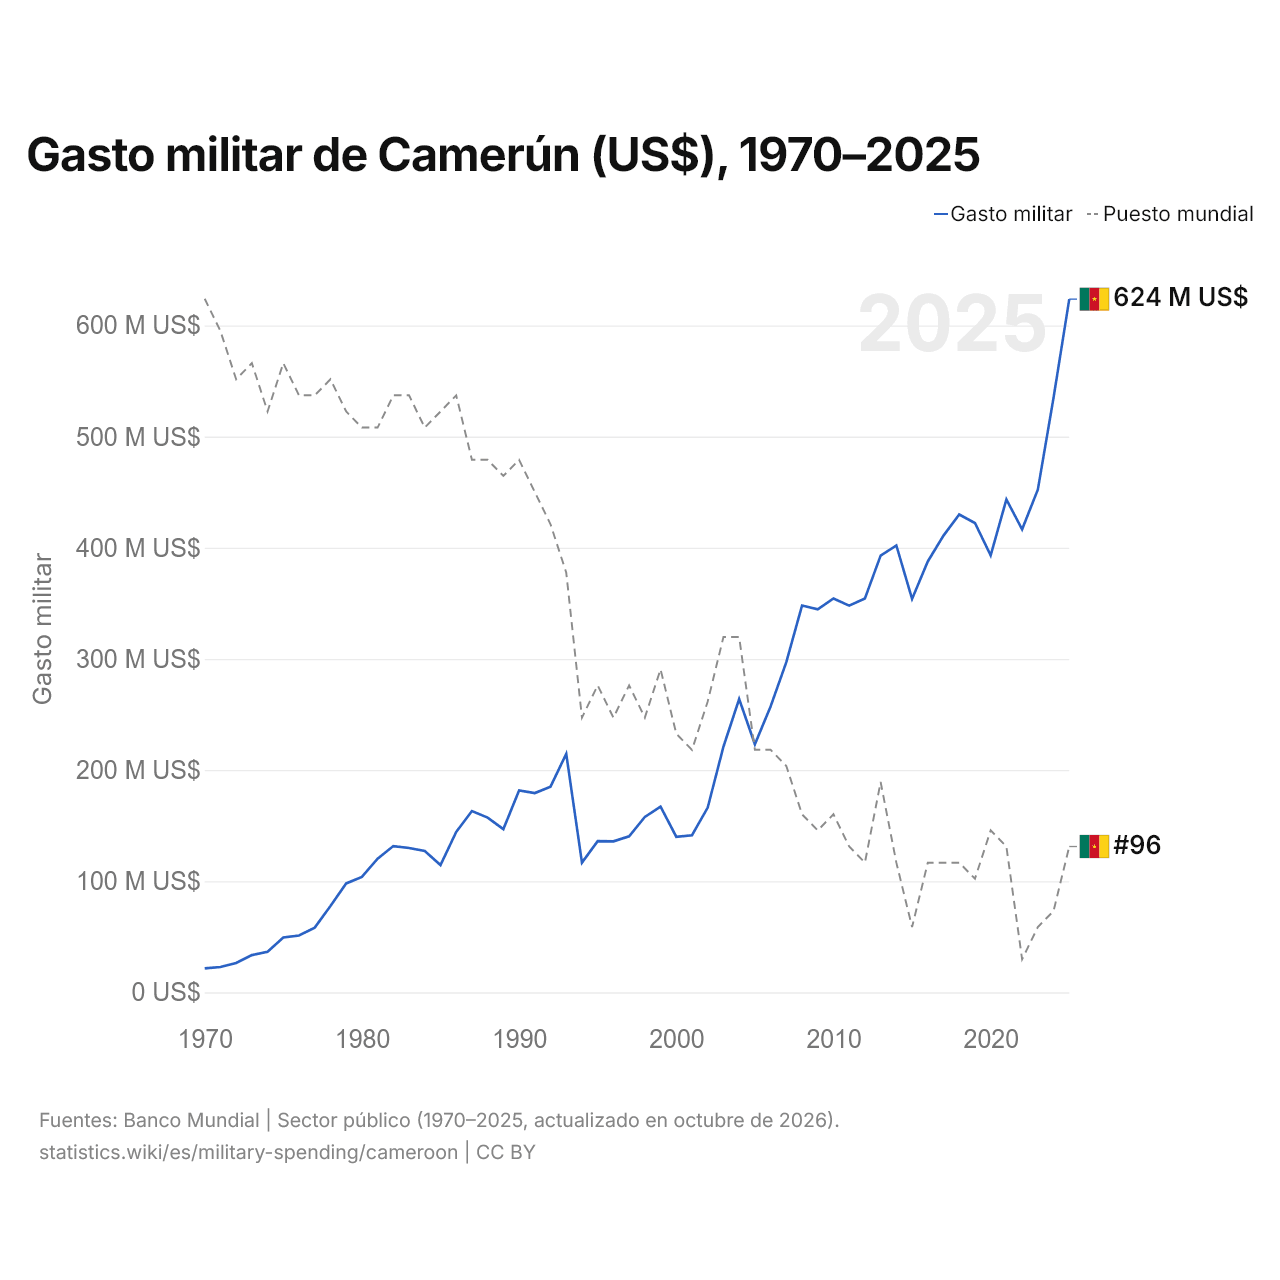
En 2025, el gasto militar de Camerún fue de 624 millones de US$, frente a 21,6 millones de US$ en 1970. El de Camerún equivalía al 0,022 % del gasto militar mundial. Ocupó el puesto 96 del mundo; en 2024, el 100. Su mejor posición fue el puesto 62, por última vez en 1970.
El gasto militar de Camerún fue el 18.º más alto de 49 países de África, y el 1,0 % del total de la región. Los efectivos de las fuerzas armadas de Camerún son 34.000, el puesto 85 del mundo.
Gasto militar de Camerún en % del PIB, 1970–2025
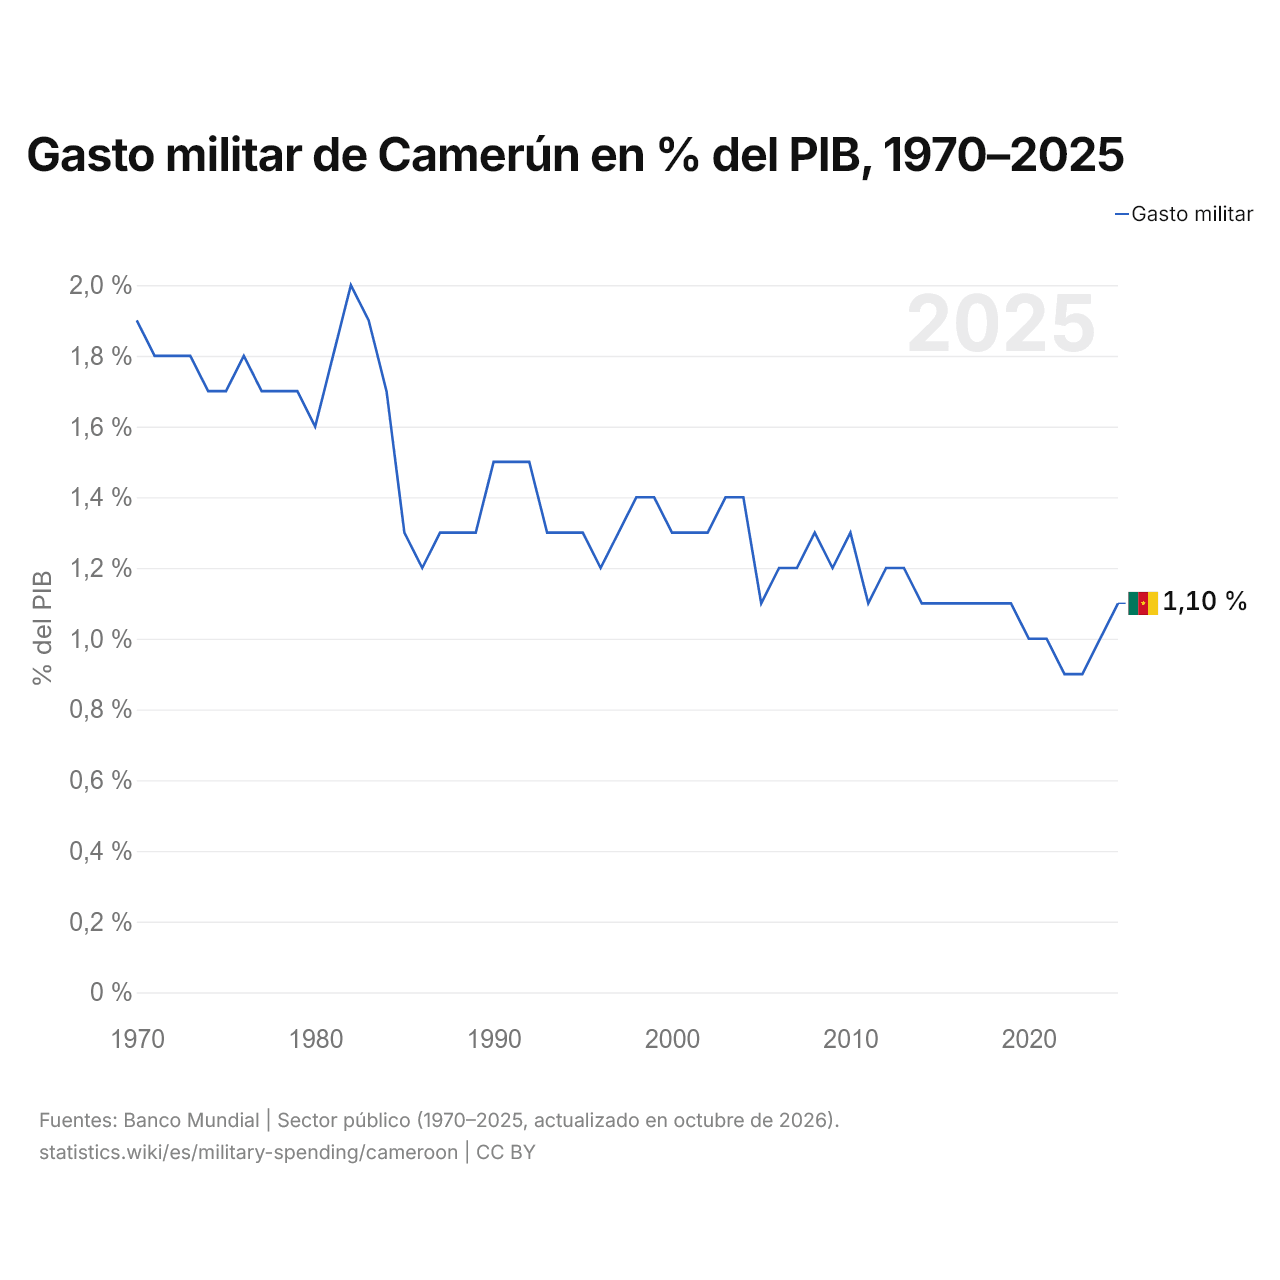
En 2025, el gasto militar de Camerún fue del 1,1 % del PIB, frente al 1,9 % de 1970. Su máximo fue del 2,0 %, en 1982.
La mayor caída del gasto militar de Camerún en diez años fue la de 2010 a 2020, de 0,3 puntos porcentuales del PIB.
Camerún en la clasificación mundial del gasto militar, 2025
| Puesto | País | Gasto militar | % del PIB | US$ por persona | Porcentaje del mundo | |
|---|---|---|---|---|---|---|
| 93 |
 Kirguistán |
660 M US$ | 2,9 % | 89,9 US$ | 0,02 % | |
| 94 |
 Guatemala |
645 M US$ | 0,5 % | 34,5 US$ | 0,02 % | |
| 95 |
 Etiopía |
624 M US$ | 0,5 % | 4,61 US$ | 0,02 % | |
| 96 |
 Camerún |
624 M US$ | 1,1 % | 20,9 US$ | 0,02 % | |
| 97 |
 Albania |
621 M US$ | 2,0 % | 264,2 US$ | 0,02 % | |
| 98 |
 Botsuana |
619 M US$ | 3,1 % | 241,7 US$ | 0,02 % | |
| 99 |
 Líbano |
585 M US$ (2024) | 2,3 % | 100,7 US$ | 0,02 % |
Comparar el gasto militar de Camerún con otros países
Fuentes:
- Banco Mundial | Sector público (1970–2025, actualizado en octubre de 2026)
Creative Commons Atribución (CC BY): puedes copiar, compartir, adaptar y reutilizar este contenido, también con fines comerciales, siempre que cites a statistics.wiki e indiques los cambios que hayas hecho. Las fuentes indicadas arriba pueden tener sus propias condiciones de licencia.