
Zambia vs República Democrática del Congo: gasto militar (US$), 1964–2025
| Año | US$ | |
|---|---|---|
 Zambia |
 RDC |
|
| 2025 | 363.934.050 US$ | 1.251.802.003 US$ |
| 2024 | 335.436.974 US$ | 920.516.916 US$ |
| 2023 | 369.211.031 US$ | 781.452.695 US$ |
| 2022 | 325.627.597 US$ | 399.792.740 US$ |
| 2021 | 217.039.380 US$ | 314.934.274 US$ |
| 2020 | 211.435.910 US$ | 340.727.945 US$ |
| 2019 | 292.683.234 US$ | 325.118.715 US$ |
| 2018 | 378.227.757 US$ | 285.720.622 US$ |
| 2017 | 336.710.640 US$ | 278.367.272 US$ |
| 2016 | 299.559.580 US$ | 395.897.167 US$ |
| 2015 | 372.583.654 US$ | 491.550.105 US$ |
| 2014 | 443.448.759 US$ | 341.224.631 US$ |
| 2013 | 381.232.547 US$ | 374.568.041 US$ |
| 2012 | 346.298.113 US$ | 332.493.969 US$ |
| 2011 | 309.111.748 US$ | 238.787.473 US$ |
| 2010 | 280.190.159 US$ | 198.429.561 US$ |
| 2009 | 265.430.993 US$ | 121.247.868 US$ |
| 2008 | 372.561.599 US$ | 158.461.763 US$ |
| 2007 | 290.094.425 US$ | 203.246.740 US$ |
| 2006 | 222.472.660 US$ | 205.102.168 US$ |
| 2005 | 153.999.868 US$ | 165.205.068 US$ |
| 2004 | 98.349.507 US$ | 137.636.618 US$ |
| 2003 | - | 78.708.312 US$ |
| 2002 | - | - |
| 2001 | - | - |
| 2000 | - | 42.043.484 US$ |
| 1999 | 56.113.456 US$ | 54.563.482 US$ |
| 1998 | - | 26.640.448 US$ |
| 1997 | 43.362.561 US$ | 85.932.666 US$ |
| 1996 | 37.835.914 US$ | 89.272.959 US$ |
| 1995 | 55.265.537 US$ | - |
| 1994 | 62.869.471 US$ | - |
| 1993 | 46.791.428 US$ | 559.518.318 US$ |
| 1992 | 86.096.617 US$ | - |
| 1991 | 78.931.029 US$ | - |
| 1990 | 112.160.951 US$ | - |
| 1989 | 167.587.301 US$ | - |
| 1988 | 89.058.441 US$ | - |
| 1987 | 72.956.603 US$ | - |
| 1986 | 60.986.144 US$ | - |
| 1985 | 53.190.783 US$ | - |
| 1984 | 81.624.174 US$ | - |
| 1983 | - | - |
| 1982 | - | - |
| 1981 | - | - |
| 1980 | - | - |
| 1979 | - | 4.480 US$ |
| 1978 | - | 5.032 US$ |
| 1977 | - | 4.311 US$ |
| 1976 | - | 3.240 US$ |
| 1975 | - | 4.639 US$ |
| 1974 | - | 5.054 US$ |
| 1973 | - | 2.747 US$ |
| 1972 | - | 2.485 US$ |
| 1971 | - | 2.717 US$ |
| 1970 | - | 2.691 US$ |
| 1969 | - | 2.100 US$ |
| 1968 | - | 1.648 US$ |
| 1967 | - | - |
| 1966 | - | 1.954 US$ |
| 1965 | - | - |
| 1964 | - | 1.128 US$ |
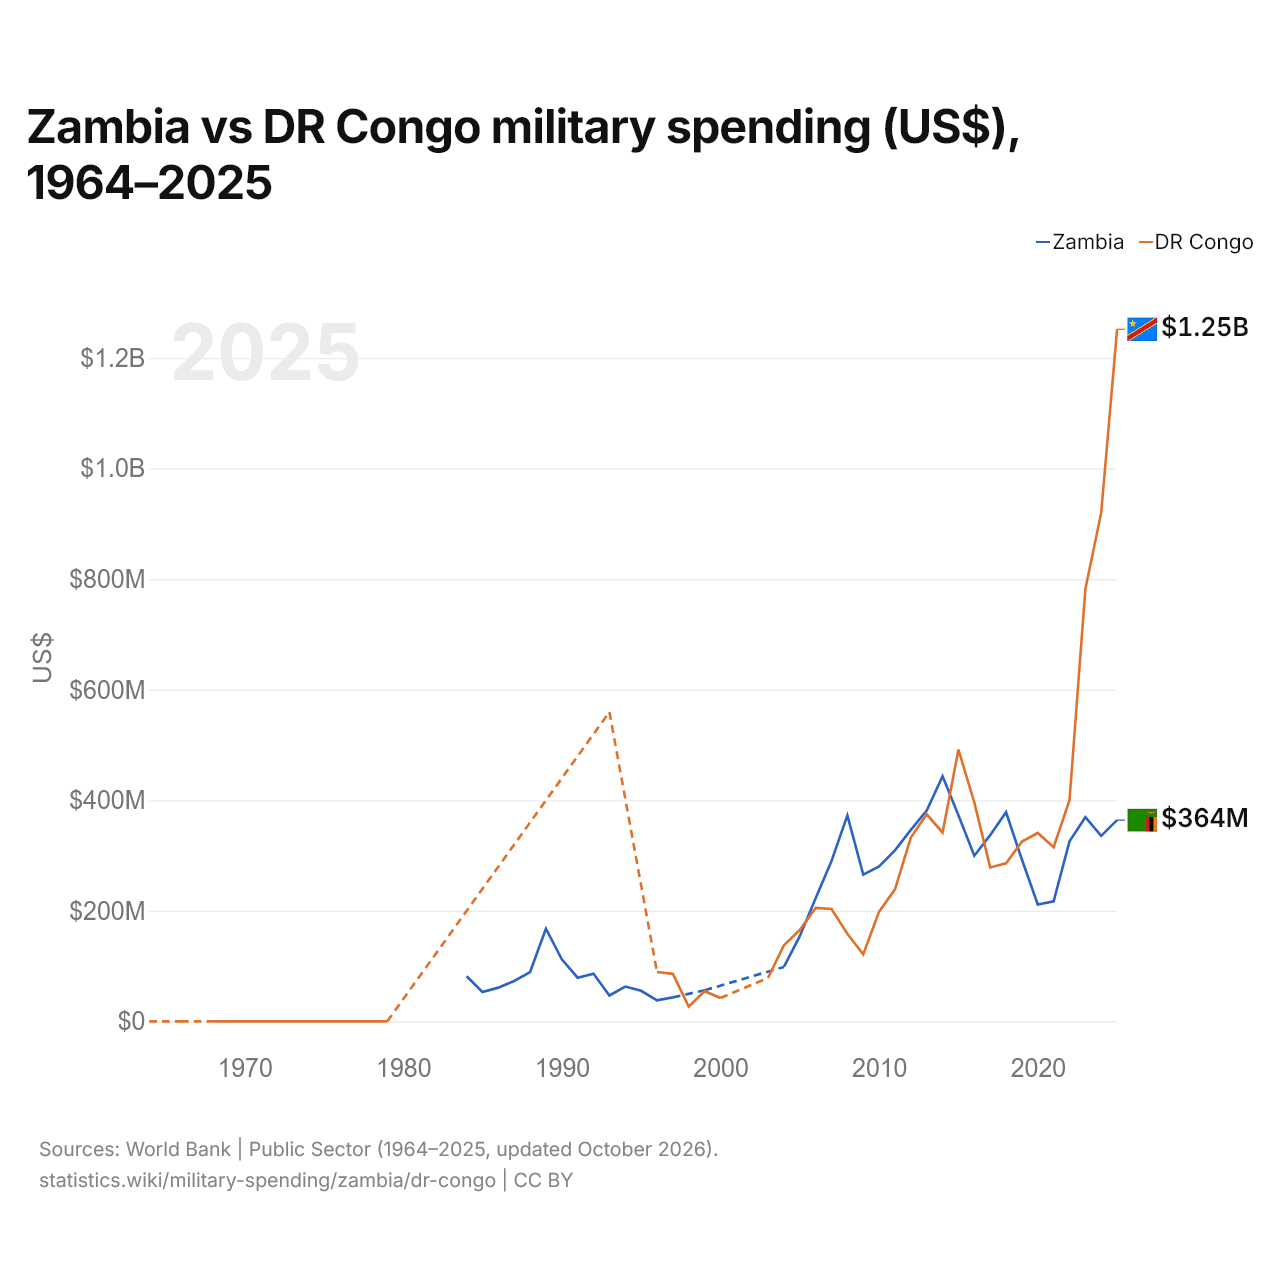
En 2025, el gasto militar fue de 364 millones de US$ en Zambia y de 1,25 mil millones de US$ en la República Democrática del Congo: 3,4 veces más en la República Democrática del Congo. En 1993 fue de 46,8 millones de US$ en Zambia y de 560 millones de US$ en la República Democrática del Congo, 12 veces más en la República Democrática del Congo.
Zambia vs República Democrática del Congo: gasto militar en % del PIB, 1964–2025
| Año | % del PIB | |
|---|---|---|
|
Zambia
|
RDC
|
|
| 2025 | 1,3 % | 1,4 % |
| 2024 | 1,3 % | 1,2 % |
| 2023 | 1,3 % | 1,1 % |
| 2022 | 1,1 % | 0,6 % |
| 2021 | 1 % | 0,5 % |
| 2020 | 1,2 % | 0,7 % |
| 2019 | 1,3 % | 0,7 % |
| 2018 | 1,4 % | 0,6 % |
| 2017 | 1,3 % | 0,7 % |
| 2016 | 1,4 % | 1 % |
| 2015 | 1,8 % | 1,2 % |
| 2014 | 1,6 % | 0,9 % |
| 2013 | 1,4 % | 1,1 % |
| 2012 | 1,4 % | 1,1 % |
| 2011 | 1,3 % | 0,9 % |
| 2010 | 1,4 % | 0,8 % |
| 2009 | 1,7 % | 0,7 % |
| 2008 | 2,1 % | 0,7 % |
| 2007 | 2,1 % | 1,1 % |
| 2006 | 1,7 % | 1,3 % |
| 2005 | 1,8 % | 1,3 % |
| 2004 | 1,6 % | 1,3 % |
| 2003 | - | 0,9 % |
| 2002 | - | - |
| 2001 | - | - |
| 2000 | - | 0,2 % |
| 1999 | 1,6 % | 1,2 % |
| 1998 | - | 0,4 % |
| 1997 | 1 % | 1,4 % |
| 1996 | 1,1 % | 1,5 % |
| 1995 | 1,5 % | - |
| 1994 | 1,7 % | - |
| 1993 | 1,4 % | 5,2 % |
| 1992 | 2,7 % | - |
| 1991 | 2,3 % | - |
| 1990 | 3,4 % | - |
| 1989 | 4,2 % | - |
| 1988 | 2,4 % | - |
| 1987 | 3,2 % | - |
| 1986 | 3,7 % | - |
| 1985 | 2,4 % | - |
| 1984 | 3 % | - |
| 1983 | - | - |
| 1982 | - | - |
| 1981 | - | - |
| 1980 | - | - |
| 1979 | - | 0 % |
| 1978 | - | 0 % |
| 1977 | - | 0 % |
| 1976 | - | 0 % |
| 1975 | - | 0 % |
| 1974 | - | 0 % |
| 1973 | - | 0 % |
| 1972 | - | 0 % |
| 1971 | - | 0 % |
| 1970 | - | 0 % |
| 1969 | - | 0 % |
| 1968 | - | 0 % |
| 1967 | - | - |
| 1966 | - | 0 % |
| 1965 | - | - |
| 1964 | - | 0 % |
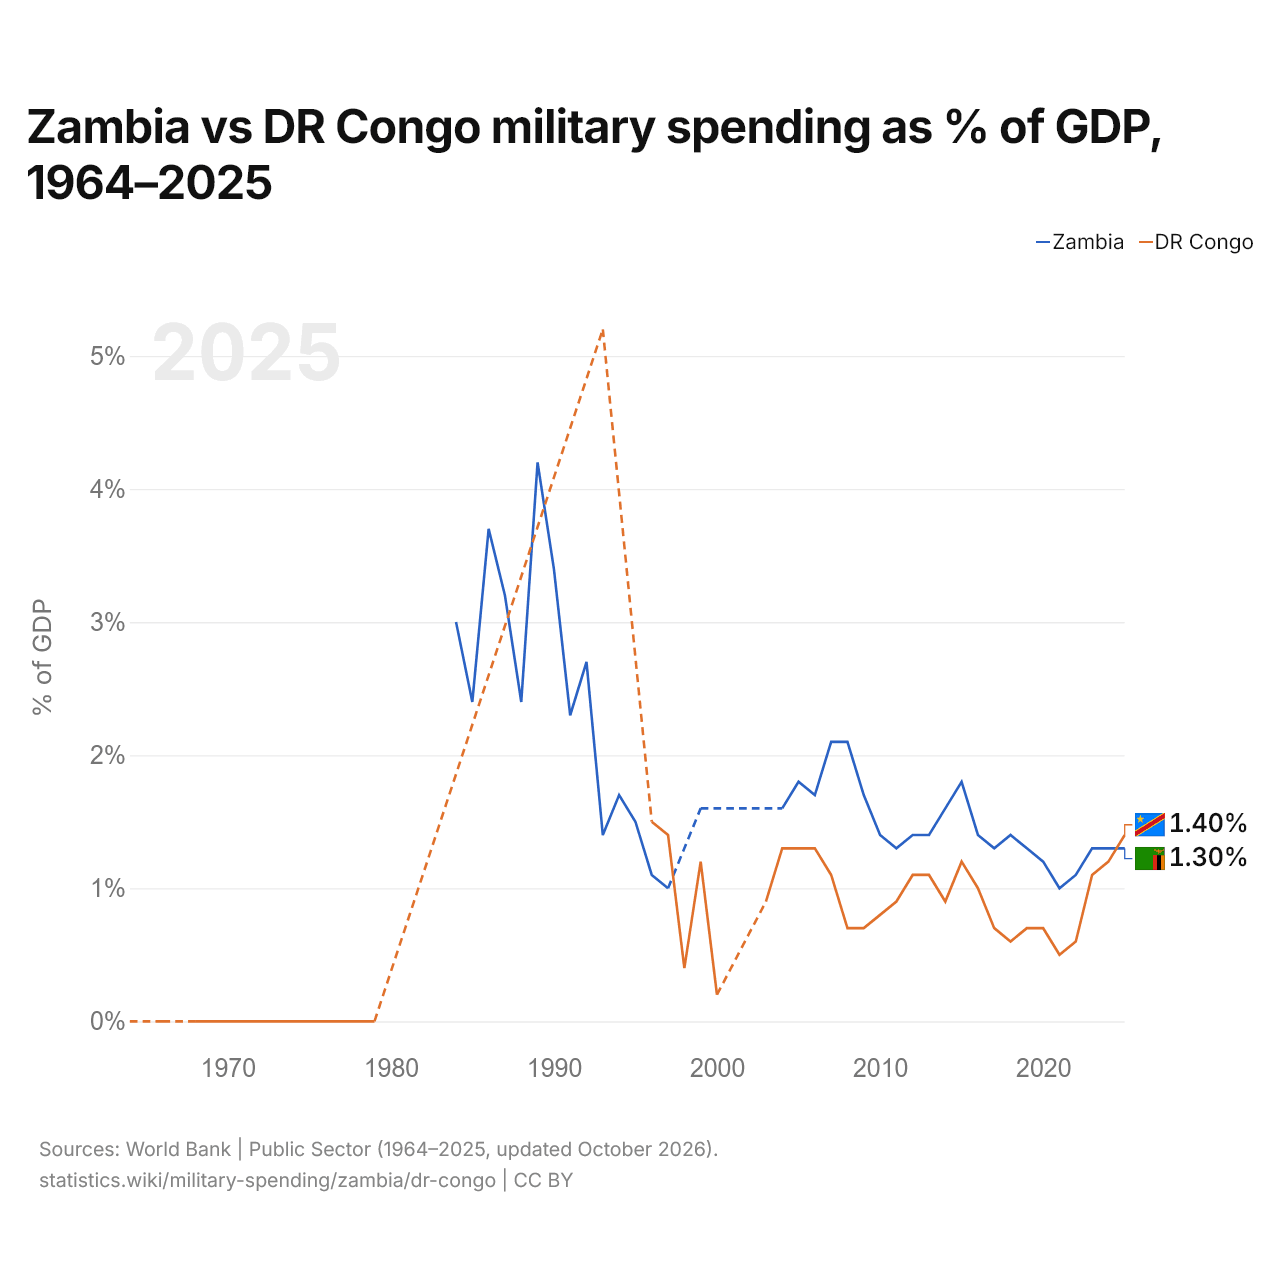
En 2025, el gasto militar fue del 1,3 % del PIB en Zambia y del 1,4 % en la República Democrática del Congo: 0,1 puntos porcentuales más en la República Democrática del Congo. En 2015 fue del 1,8 % en Zambia y del 1,2 % en la República Democrática del Congo, 0,6 puntos porcentuales más en Zambia.
Zambia vs República Democrática del Congo: datos del gasto militar
|
Zambia
|
RDC
|
|
|---|---|---|
| US$, 2025 | 364 M US$ | 1250 M US$ |
| % del PIB, 2025 | 1,3 % | 1,4 % |
| Por persona, US$ | 16,6 US$ | 11,1 US$ |
| Porcentaje del mundo | 0,01 % | 0,04 % |
| Puesto mundial | 113/154 | 79/154 |
Comparar el gasto militar de 2 países cualesquiera
Fuentes:
- Banco Mundial | Sector público (1964–2025, actualizado en octubre de 2026)
Creative Commons Atribución (CC BY): puedes copiar, compartir, adaptar y reutilizar este contenido, también con fines comerciales, siempre que cites a statistics.wiki e indiques los cambios que hayas hecho. Las fuentes indicadas arriba pueden tener sus propias condiciones de licencia.