
Ruanda vs República Democrática del Congo: gasto militar (US$), 1964–2025
| Año | US$ | |
|---|---|---|
 Ruanda |
 RDC |
|
| 2025 | 210.579.140 US$ | 1.251.802.003 US$ |
| 2024 | 185.897.928 US$ | 920.516.916 US$ |
| 2023 | 185.424.217 US$ | 781.452.695 US$ |
| 2022 | 183.316.934 US$ | 399.792.740 US$ |
| 2021 | 170.163.659 US$ | 314.934.274 US$ |
| 2020 | 154.550.725 US$ | 340.727.945 US$ |
| 2019 | 126.013.645 US$ | 325.118.715 US$ |
| 2018 | 119.193.678 US$ | 285.720.622 US$ |
| 2017 | 114.453.074 US$ | 278.367.272 US$ |
| 2016 | 106.644.040 US$ | 395.897.167 US$ |
| 2015 | 102.521.572 US$ | 491.550.105 US$ |
| 2014 | 89.652.489 US$ | 341.224.631 US$ |
| 2013 | 81.376.772 US$ | 374.568.041 US$ |
| 2012 | 78.759.399 US$ | 332.493.969 US$ |
| 2011 | 74.484.612 US$ | 238.787.473 US$ |
| 2010 | 73.643.652 US$ | 198.429.561 US$ |
| 2009 | 74.351.636 US$ | 121.247.868 US$ |
| 2008 | 66.901.218 US$ | 158.461.763 US$ |
| 2007 | 54.872.649 US$ | 203.246.740 US$ |
| 2006 | 53.825.046 US$ | 205.102.168 US$ |
| 2005 | 51.138.108 US$ | 165.205.068 US$ |
| 2004 | 46.899.342 US$ | 137.636.618 US$ |
| 2003 | 52.325.444 US$ | 78.708.312 US$ |
| 2002 | 59.942.138 US$ | - |
| 2001 | 66.790.213 US$ | - |
| 2000 | 73.143.785 US$ | 42.043.484 US$ |
| 1999 | 95.950.450 US$ | 54.563.482 US$ |
| 1998 | 87.086.444 US$ | 26.640.448 US$ |
| 1997 | 77.275.256 US$ | 85.932.666 US$ |
| 1996 | 73.658.490 US$ | 89.272.959 US$ |
| 1995 | 7.862.144 US$ | - |
| 1994 | 25.909.091 US$ | - |
| 1993 | 89.435.807 US$ | 559.518.318 US$ |
| 1992 | 87.057.474 US$ | - |
| 1991 | 105.313.349 US$ | - |
| 1990 | 95.100.657 US$ | - |
| 1989 | 42.178.296 US$ | - |
| 1988 | 38.190.398 US$ | - |
| 1987 | 36.142.038 US$ | - |
| 1986 | 34.917.954 US$ | - |
| 1985 | 27.250.507 US$ | - |
| 1984 | 25.462.465 US$ | - |
| 1983 | 28.042.214 US$ | - |
| 1982 | 28.187.865 US$ | - |
| 1981 | 28.692.140 US$ | - |
| 1980 | 23.550.092 US$ | - |
| 1979 | 19.385.083 US$ | 4.480 US$ |
| 1978 | 14.384.134 US$ | 5.032 US$ |
| 1977 | 16.069.673 US$ | 4.311 US$ |
| 1976 | 10.292.667 US$ | 3.240 US$ |
| 1975 | 9.314.443 US$ | 4.639 US$ |
| 1974 | 4.539.104 US$ | 5.054 US$ |
| 1973 | 5.480.251 US$ | 2.747 US$ |
| 1972 | - | 2.485 US$ |
| 1971 | - | 2.717 US$ |
| 1970 | - | 2.691 US$ |
| 1969 | - | 2.100 US$ |
| 1968 | - | 1.648 US$ |
| 1967 | - | - |
| 1966 | - | 1.954 US$ |
| 1965 | - | - |
| 1964 | - | 1.128 US$ |
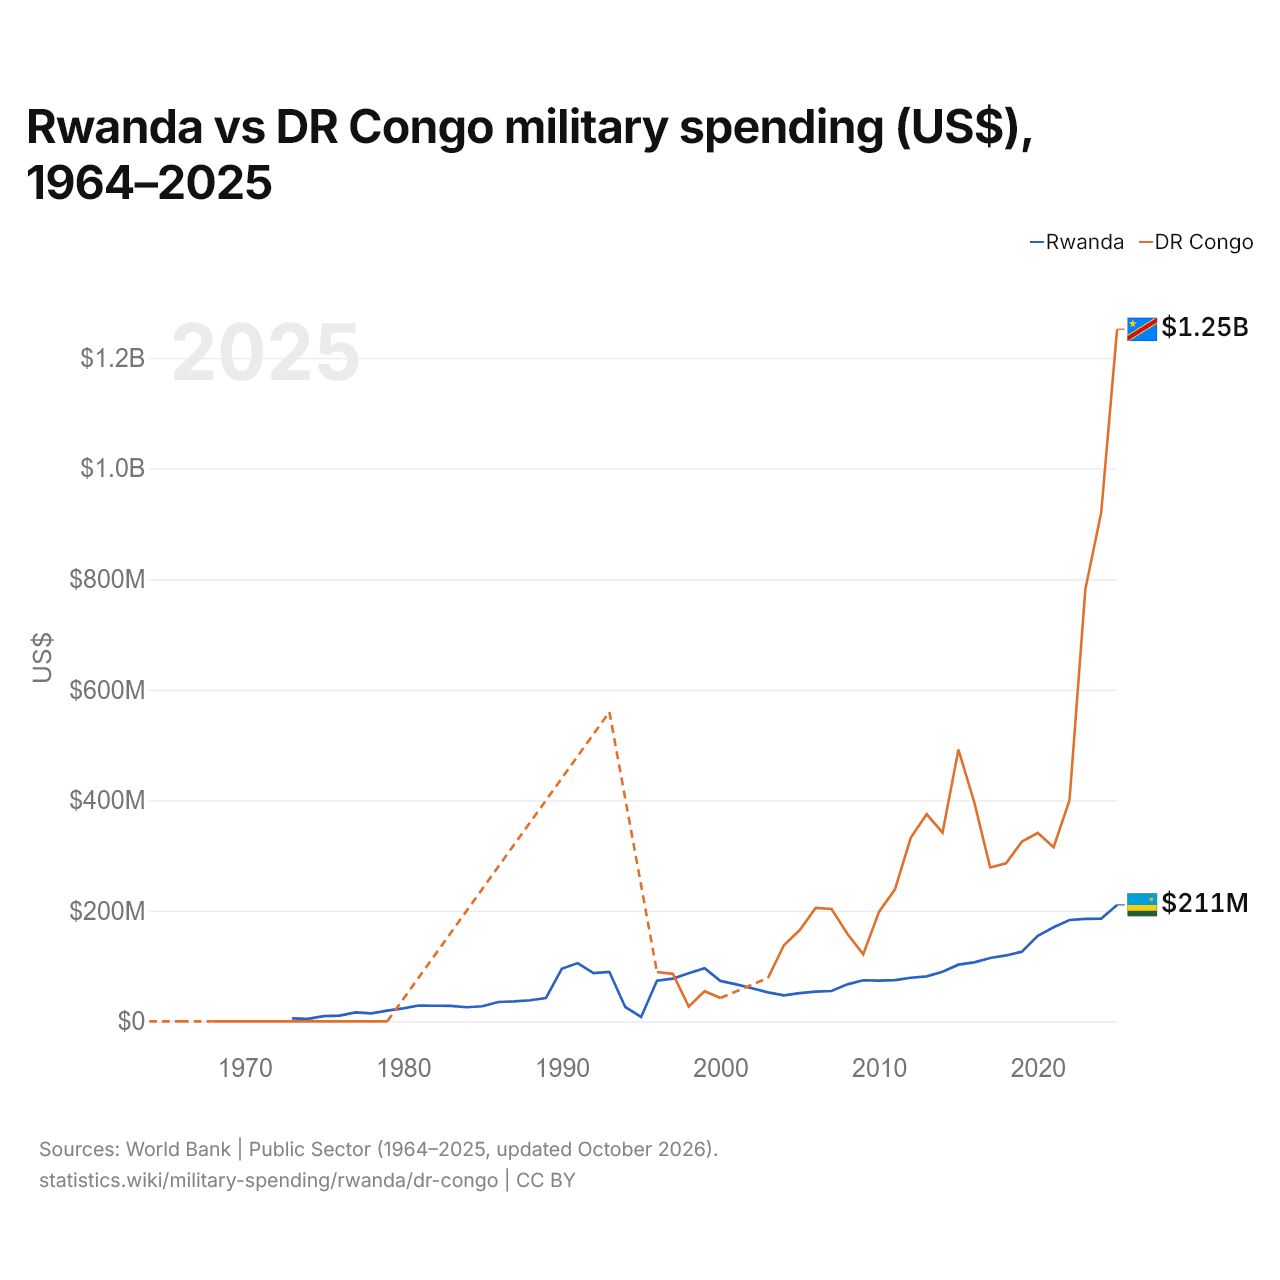
En 2025, el gasto militar fue de 211 millones de US$ en Ruanda y de 1,25 mil millones de US$ en la República Democrática del Congo: 5,9 veces más en la República Democrática del Congo. En 1973 fue de 5,48 millones de US$ en Ruanda y de 2750 US$ en la República Democrática del Congo, 2000 veces más en Ruanda.
Ruanda vs República Democrática del Congo: gasto militar en % del PIB, 1964–2025
| Año | % del PIB | |
|---|---|---|
|
Ruanda
|
RDC
|
|
| 2025 | 1,3 % | 1,4 % |
| 2024 | 1,2 % | 1,2 % |
| 2023 | 1,3 % | 1,1 % |
| 2022 | 1,3 % | 0,6 % |
| 2021 | 1,5 % | 0,5 % |
| 2020 | 1,5 % | 0,7 % |
| 2019 | 1,2 % | 0,7 % |
| 2018 | 1,2 % | 0,6 % |
| 2017 | 1,2 % | 0,7 % |
| 2016 | 1,2 % | 1 % |
| 2015 | 1,2 % | 1,2 % |
| 2014 | 1,1 % | 0,9 % |
| 2013 | 1,1 % | 1,1 % |
| 2012 | 1 % | 1,1 % |
| 2011 | 1,1 % | 0,9 % |
| 2010 | 1,2 % | 0,8 % |
| 2009 | 1,3 % | 0,7 % |
| 2008 | 1,3 % | 0,7 % |
| 2007 | 1,4 % | 1,1 % |
| 2006 | 1,6 % | 1,3 % |
| 2005 | 1,7 % | 1,3 % |
| 2004 | 2 % | 1,3 % |
| 2003 | 2,4 % | 0,9 % |
| 2002 | 3 % | - |
| 2001 | 3,4 % | - |
| 2000 | 3,5 % | 0,2 % |
| 1999 | 4,4 % | 1,2 % |
| 1998 | 4,4 % | 0,4 % |
| 1997 | 4,2 % | 1,4 % |
| 1996 | 5,3 % | 1,5 % |
| 1995 | 0,6 % | - |
| 1994 | 3,4 % | - |
| 1993 | 4,5 % | 5,2 % |
| 1992 | 4,3 % | - |
| 1991 | 5,5 % | - |
| 1990 | 3,7 % | - |
| 1989 | 1,8 % | - |
| 1988 | 1,6 % | - |
| 1987 | 1,7 % | - |
| 1986 | 1,8 % | - |
| 1985 | 1,6 % | - |
| 1984 | 1,6 % | - |
| 1983 | 1,9 % | - |
| 1982 | 2 % | - |
| 1981 | 2 % | - |
| 1980 | 1,9 % | - |
| 1979 | 1,7 % | 0 % |
| 1978 | 1,6 % | 0 % |
| 1977 | 2,2 % | 0 % |
| 1976 | 1,6 % | 0 % |
| 1975 | 1,6 % | 0 % |
| 1974 | 1,5 % | 0 % |
| 1973 | 1,9 % | 0 % |
| 1972 | - | 0 % |
| 1971 | - | 0 % |
| 1970 | - | 0 % |
| 1969 | - | 0 % |
| 1968 | - | 0 % |
| 1967 | - | - |
| 1966 | - | 0 % |
| 1965 | - | - |
| 1964 | - | 0 % |
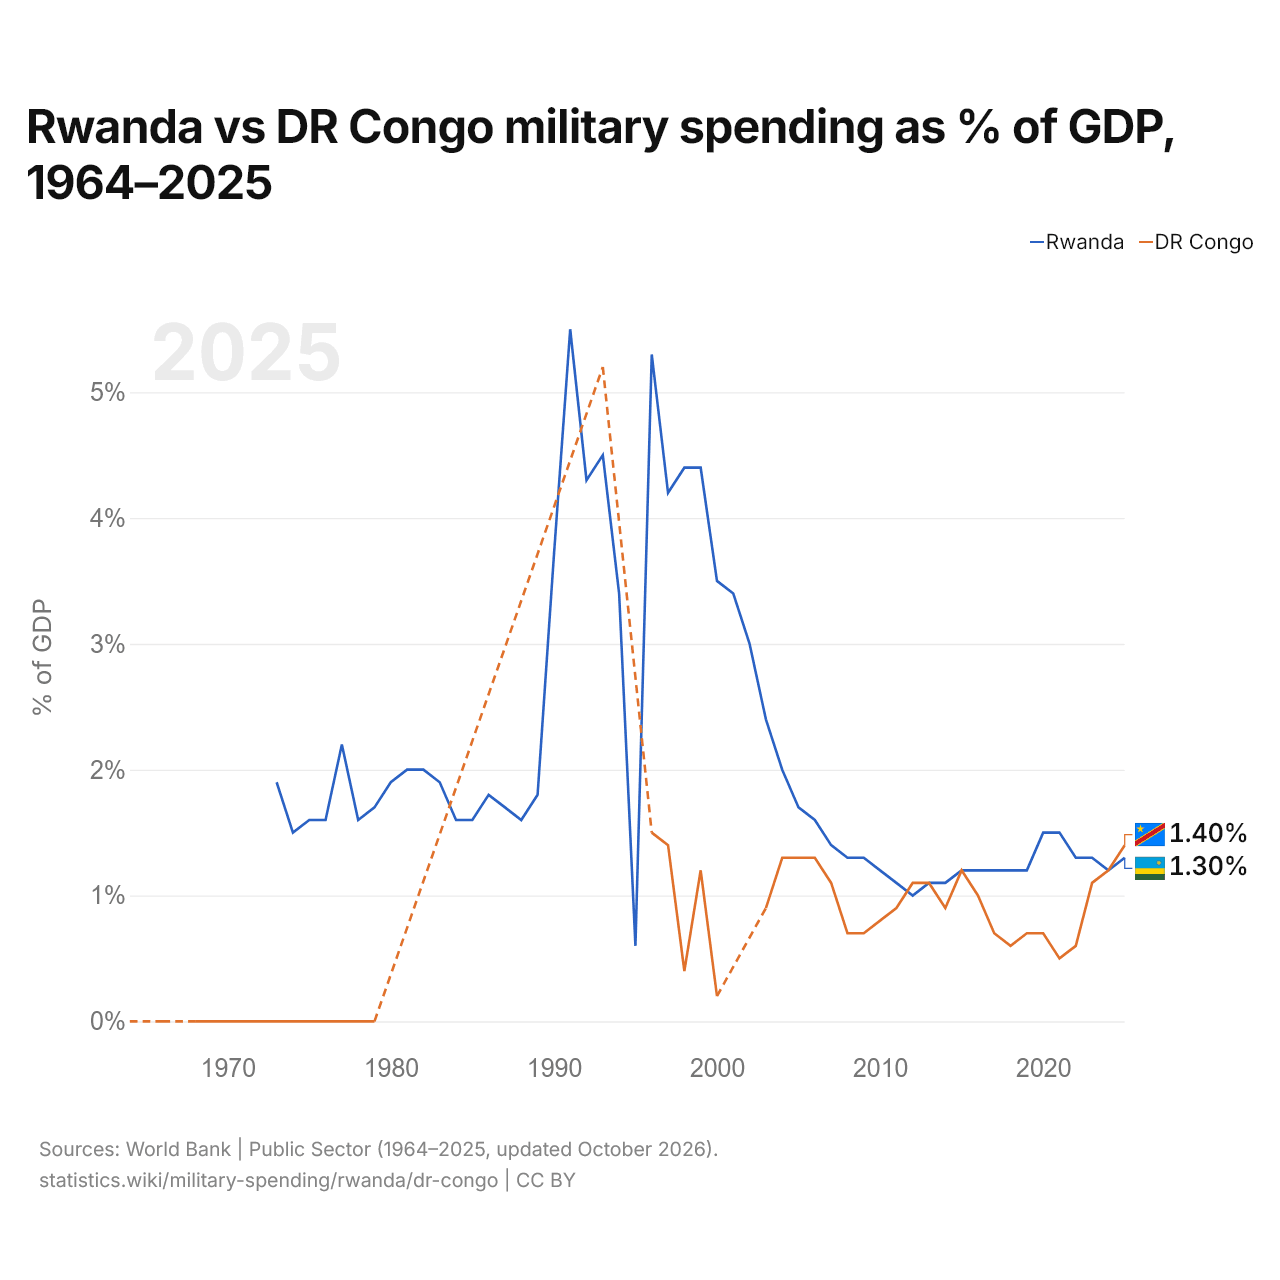
En 2025, el gasto militar fue del 1,3 % del PIB en Ruanda y del 1,4 % en la República Democrática del Congo: 0,1 puntos porcentuales más en la República Democrática del Congo. En 2015 fue del 1,2 % en Ruanda y del 1,2 % en la República Democrática del Congo.
La diferencia fue máxima en 1998, cuando el gasto militar de Ruanda superó al de la República Democrática del Congo en 4,0 puntos porcentuales del PIB.
Ruanda vs República Democrática del Congo: datos del gasto militar
|
Ruanda
|
RDC
|
|
|---|---|---|
| US$, 2025 | 211 M US$ | 1250 M US$ |
| % del PIB, 2025 | 1,3 % | 1,4 % |
| Por persona, US$ | 14,5 US$ | 11,1 US$ |
| Porcentaje del mundo | 0,007 % | 0,04 % |
| Puesto mundial | 128/154 | 79/154 |
Comparar el gasto militar de 2 países cualesquiera
Fuentes:
- Banco Mundial | Sector público (1964–2025, actualizado en octubre de 2026)
Creative Commons Atribución (CC BY): puedes copiar, compartir, adaptar y reutilizar este contenido, también con fines comerciales, siempre que cites a statistics.wiki e indiques los cambios que hayas hecho. Las fuentes indicadas arriba pueden tener sus propias condiciones de licencia.