
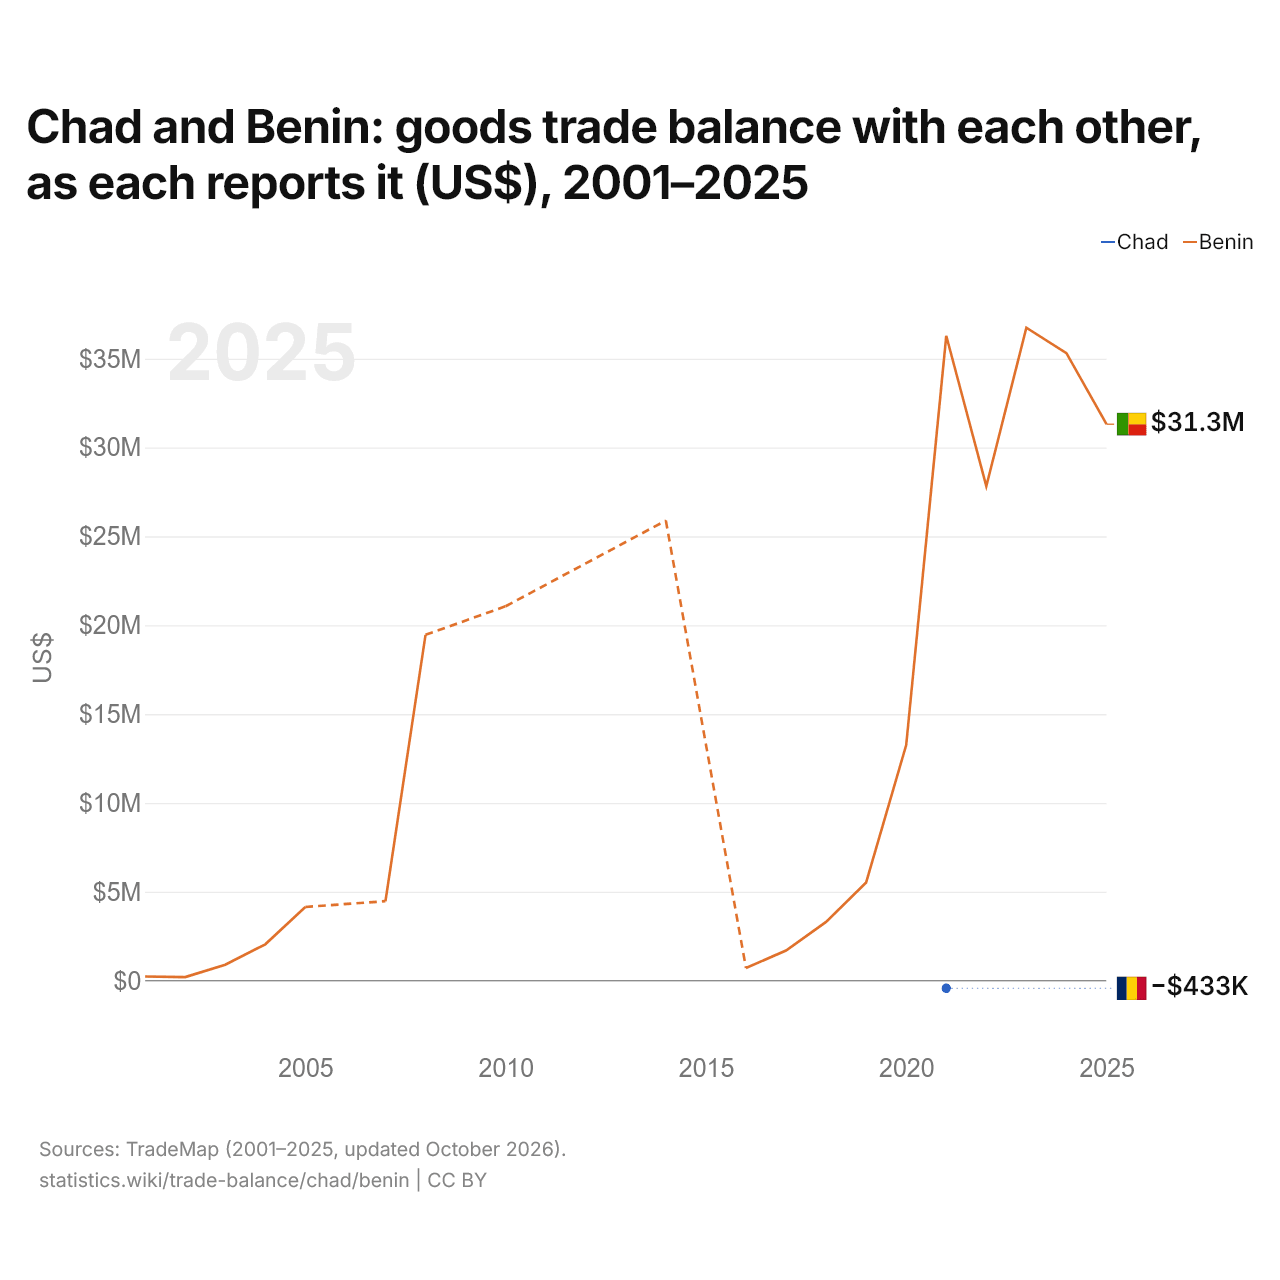
Le Tchad et le Bénin : solde de leur commerce de biens bilatéral, selon chacun ($ US), 2001–2025
| Année | $ US | |
|---|---|---|
| Tchad | Bénin | |
| 2025 | - | 31 312 000 $ US |
| 2024 | - | 35 307 000 $ US |
| 2023 | - | 36 741 000 $ US |
| 2022 | - | 27 820 000 $ US |
| 2021 | −433 000 $ US | 36 287 000 $ US |
| 2020 | - | 13 256 000 $ US |
| 2019 | - | 5 521 000 $ US |
| 2018 | - | 3 300 000 $ US |
| 2017 | - | 1 695 000 $ US |
| 2016 | - | 710 000 $ US |
| 2015 | - | - |
| 2014 | - | 25 888 000 $ US |
| 2013 | - | - |
| 2012 | - | - |
| 2011 | - | - |
| 2010 | - | 21 067 000 $ US |
| 2009 | - | - |
| 2008 | - | 19 456 000 $ US |
| 2007 | - | 4 470 000 $ US |
| 2006 | - | - |
| 2005 | - | 4 144 000 $ US |
| 2004 | - | 2 041 000 $ US |
| 2003 | - | 894 000 $ US |
| 2002 | - | 200 000 $ US |
| 2001 | - | 233 000 $ US |
Selon le Tchad, son commerce de biens avec le Bénin affichait un déficit de 433 000 dollars ; selon le Bénin, son commerce de biens avec le Tchad affichait un excédent de 36,3 millions de dollars.
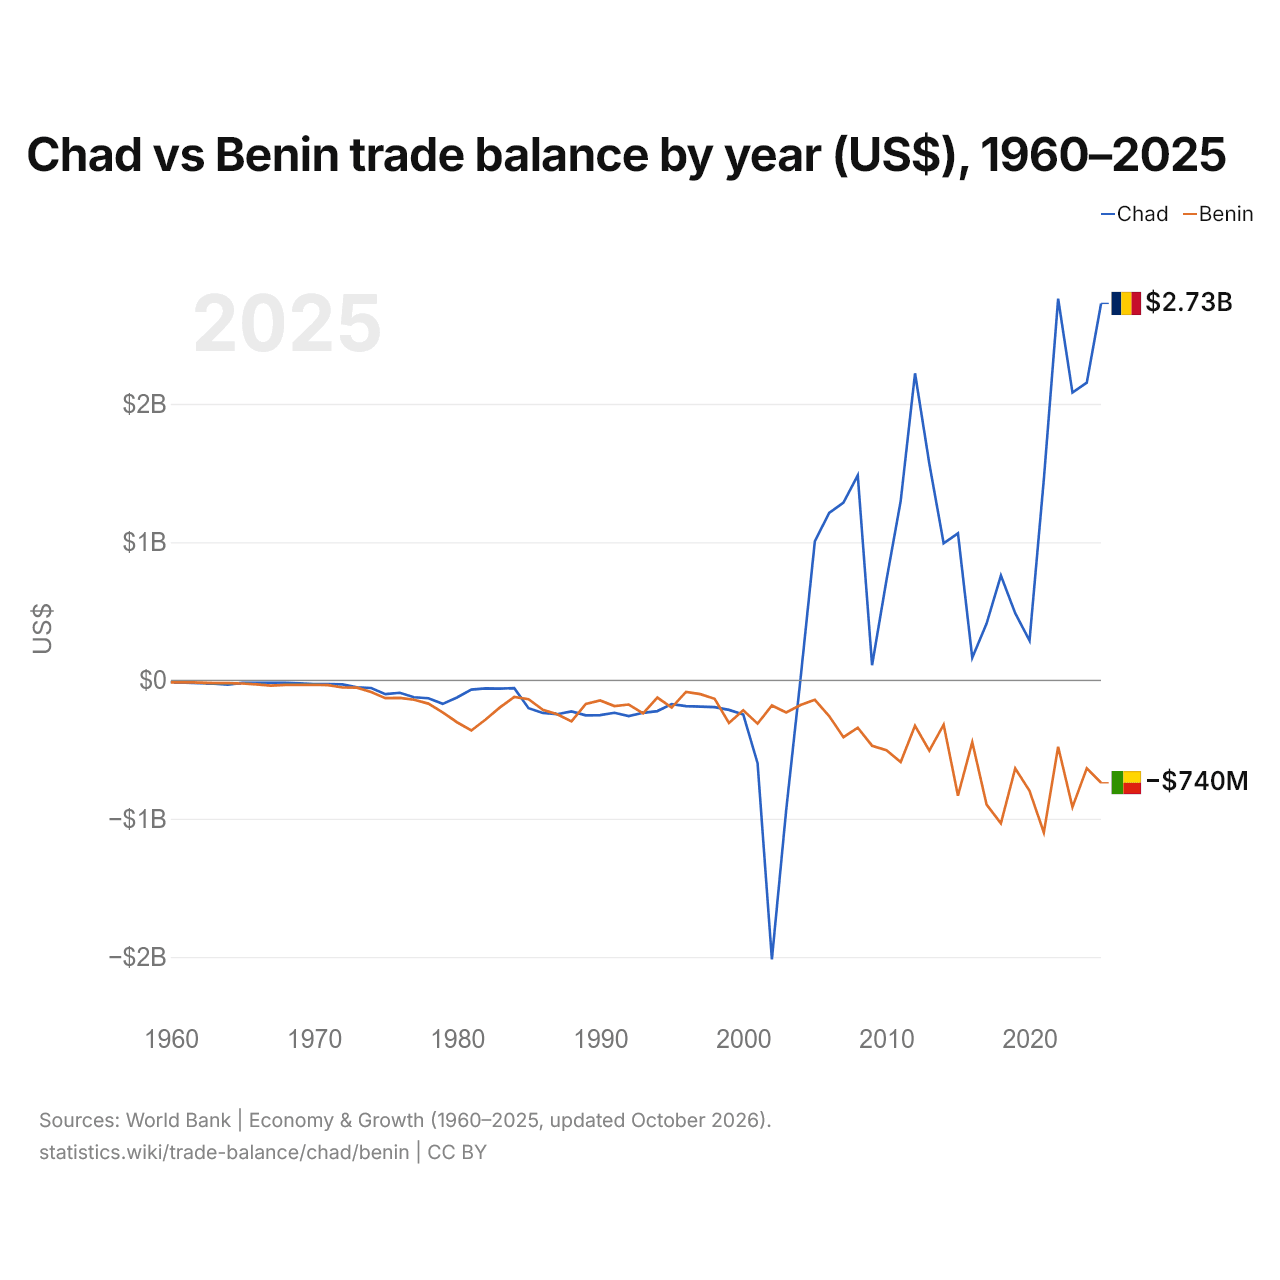
Tchad vs Bénin : balance commerciale par année ($ US), 1960–2025
| Année | $ US | |
|---|---|---|
 Tchad |
 Bénin |
|
| 2025 | 2 726 183 804 $ US | −739 953 472 $ US |
| 2024 | 2 152 948 170 $ US | −635 776 349 $ US |
| 2023 | 2 081 320 409 $ US | −916 006 654 $ US |
| 2022 | 2 760 264 886 $ US | −479 361 183 $ US |
| 2021 | 1 454 393 844 $ US | −1 099 683 505 $ US |
| 2020 | 288 335 711 $ US | −798 187 314 $ US |
| 2019 | 485 799 027 $ US | −636 152 533 $ US |
| 2018 | 758 859 822 $ US | −1 033 558 670 $ US |
| 2017 | 411 306 680 $ US | −897 423 731 $ US |
| 2016 | 163 865 226 $ US | −446 050 448 $ US |
| 2015 | 1 063 645 997 $ US | −833 090 755 $ US |
| 2014 | 991 850 186 $ US | −319 704 476 $ US |
| 2013 | 1 567 179 887 $ US | −508 106 994 $ US |
| 2012 | 2 220 570 912 $ US | −327 919 476 $ US |
| 2011 | 1 298 383 437 $ US | −590 028 152 $ US |
| 2010 | 723 385 760 $ US | −504 111 170 $ US |
| 2009 | 110 187 474 $ US | −472 001 562 $ US |
| 2008 | 1 482 454 425 $ US | −341 975 491 $ US |
| 2007 | 1 285 548 126 $ US | −410 746 118 $ US |
| 2006 | 1 210 797 022 $ US | −257 367 391 $ US |
| 2005 | 1 004 707 120 $ US | −139 802 468 $ US |
| 2004 | 11 018 448 $ US | −178 024 699 $ US |
| 2003 | −935 655 988 $ US | −231 496 422 $ US |
| 2002 | −2 016 395 170 $ US | −180 994 317 $ US |
| 2001 | −598 629 794 $ US | −312 362 646 $ US |
| 2000 | −247 028 950 $ US | −216 041 108 $ US |
| 1999 | −212 884 183 $ US | −307 898 181 $ US |
| 1998 | −193 248 745 $ US | −132 765 181 $ US |
| 1997 | −188 844 927 $ US | −98 883 444 $ US |
| 1996 | −185 214 642 $ US | −83 115 274 $ US |
| 1995 | −171 175 537 $ US | −196 617 144 $ US |
| 1994 | −221 539 913 $ US | −123 794 026 $ US |
| 1993 | −234 126 641 $ US | −237 760 308 $ US |
| 1992 | −258 247 221 $ US | −173 980 881 $ US |
| 1991 | −233 633 759 $ US | −185 528 219 $ US |
| 1990 | −250 821 790 $ US | −144 205 941 $ US |
| 1989 | −252 719 368 $ US | −169 902 128 $ US |
| 1988 | −223 651 230 $ US | −296 170 446 $ US |
| 1987 | −244 124 531 $ US | −245 034 344 $ US |
| 1986 | −234 726 698 $ US | −212 968 995 $ US |
| 1985 | −200 626 220 $ US | −135 900 638 $ US |
| 1984 | −55 469 972 $ US | −119 330 544 $ US |
| 1983 | −59 290 086 $ US | −195 119 123 $ US |
| 1982 | −57 845 650 $ US | −282 908 154 $ US |
| 1981 | −66 304 008 $ US | −361 879 959 $ US |
| 1980 | −123 141 841 $ US | −302 207 755 $ US |
| 1979 | −169 317 995 $ US | −231 379 215 $ US |
| 1978 | −128 600 162 $ US | −167 380 159 $ US |
| 1977 | −121 770 572 $ US | −139 523 362 $ US |
| 1976 | −89 205 206 $ US | −125 973 750 $ US |
| 1975 | −98 979 168 $ US | −127 825 140 $ US |
| 1974 | −54 895 339 $ US | −84 184 917 $ US |
| 1973 | −50 296 952 $ US | −51 891 175 $ US |
| 1972 | −28 211 525 $ US | −50 945 766 $ US |
| 1971 | −25 822 268 $ US | −33 664 169 $ US |
| 1970 | −27 170 047 $ US | −30 976 478 $ US |
| 1969 | −21 186 282 $ US | −31 934 691 $ US |
| 1968 | −16 997 090 $ US | −31 790 215 $ US |
| 1967 | −17 103 460 $ US | −37 072 590 $ US |
| 1966 | −17 530 807 $ US | −28 322 050 $ US |
| 1965 | −17 981 129 $ US | −22 143 653 $ US |
| 1964 | −29 817 992 $ US | −19 172 871 $ US |
| 1963 | −23 286 442 $ US | −19 817 885 $ US |
| 1962 | −20 022 490 $ US | −15 229 913 $ US |
| 1961 | −15 515 635 $ US | −11 668 270 $ US |
| 1960 | −11 439 256 $ US | −13 540 909 $ US |
En 2025, la balance commerciale du Tchad affichait un excédent de 2,73 milliards de dollars et celle du Bénin un déficit de 740 millions de dollars. En 1960, la balance commerciale du Tchad affichait un déficit de 11,4 millions de dollars et celle du Bénin un déficit de 13,5 millions de dollars.
De 1960 à 2025, la balance commerciale du Tchad a été excédentaire pendant 22 des 66 années, et celle du Bénin pendant aucune. Les balances commerciales du Tchad et du Bénin ont été déficitaires en même temps pendant 44 de ces années, la dernière fois en 2003.
Tchad vs Bénin : chiffres de la balance commerciale
|
Tchad
|
Bénin
|
|
|---|---|---|
| Biens et services, $ US | +2,73 Md $US (2025) | −740 M $US (2025) |
| % du PIB | +12,7 % (2025) | −3,0 % (2025) |
| Années d'excédent depuis 2000 | 22 sur 26 | 0 sur 26 |
| Solde des biens entre les deux, chiffres propres | −433 k $US (2021) | +31,3 M $US (2025) |
| Premier excédent en biens avec | Malaisie (+508 M $US, 2025) | Bangladesh (+342 M $US, 2025) |
| Premier déficit en biens avec | Chine (−374 M $US, 2025) | Inde (−805 M $US, 2025) |
Comparer la balance commerciale de 2 pays au choix
Sources :
- Banque mondiale | Économie et croissance (1960–2025, mis à jour en octobre 2026)
- TradeMap (2001–2025, mis à jour en octobre 2026)
Creative Commons Attribution (CC BY) : vous pouvez copier, partager, adapter et réutiliser ce contenu, y compris à des fins commerciales, à condition de citer statistics.wiki et d’indiquer les modifications apportées. Les sources citées ci-dessus peuvent avoir leurs propres conditions de licence.