
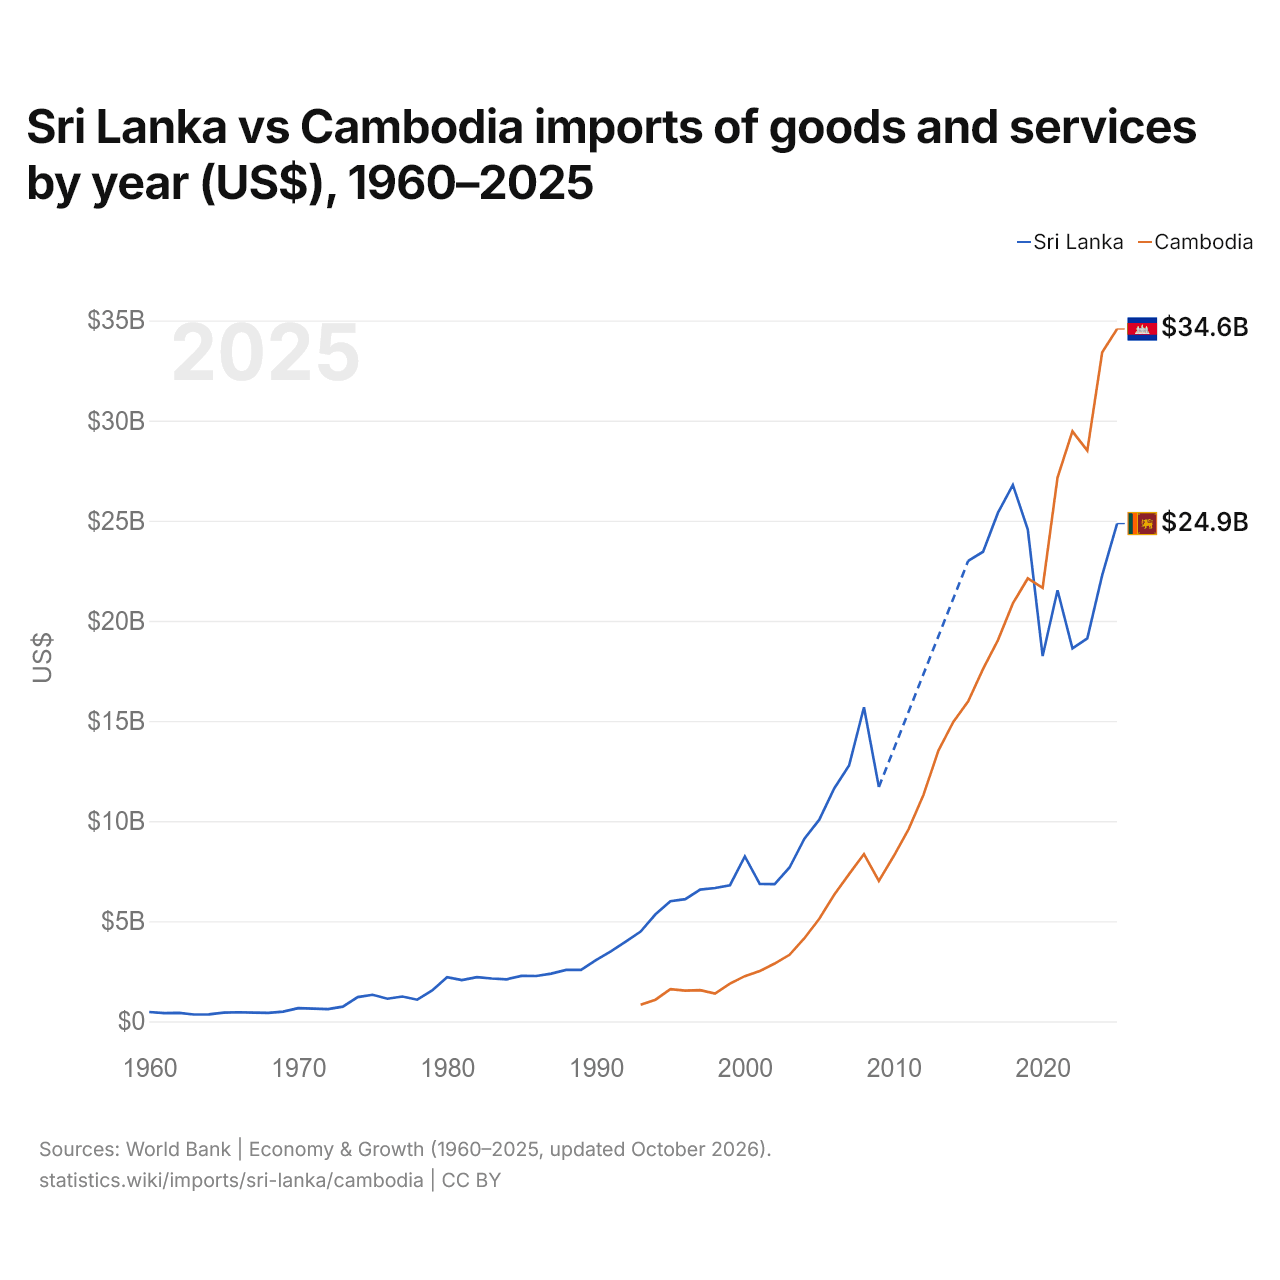
Sri Lanka vs Camboja: importações de bens e serviços por ano (US$), 1960–2025
1x
| Ano | US$ | |
|---|---|---|
 Sri Lanka |
 Camboja |
|
| 2025 | US$ 24.857.449.190 | US$ 34.576.163.751 |
| 2024 | US$ 22.277.780.954 | US$ 33.412.575.812 |
| 2023 | US$ 19.126.705.821 | US$ 28.497.892.006 |
| 2022 | US$ 18.626.984.768 | US$ 29.462.601.452 |
| 2021 | US$ 21.525.852.974 | US$ 27.158.061.718 |
| 2020 | US$ 18.243.032.009 | US$ 21.651.131.247 |
| 2019 | US$ 24.565.416.614 | US$ 22.117.532.079 |
| 2018 | US$ 26.788.997.949 | US$ 20.870.727.998 |
| 2017 | US$ 25.400.652.317 | US$ 19.038.733.852 |
| 2016 | US$ 23.449.857.058 | US$ 17.599.744.248 |
| 2015 | US$ 22.995.302.384 | US$ 15.985.986.398 |
| 2014 | - | US$ 14.949.702.395 |
| 2013 | - | US$ 13.521.734.447 |
| 2012 | - | US$ 11.311.870.012 |
| 2011 | - | US$ 9.598.623.051 |
| 2010 | - | US$ 8.253.700.555 |
| 2009 | US$ 11.703.149.677 | US$ 7.011.246.138 |
| 2008 | US$ 15.686.042.402 | US$ 8.353.365.209 |
| 2007 | US$ 12.775.598.413 | US$ 7.349.164.263 |
| 2006 | US$ 11.627.135.437 | US$ 6.319.381.671 |
| 2005 | US$ 10.071.562.189 | US$ 5.123.916.348 |
| 2004 | US$ 9.122.927.167 | US$ 4.149.673.263 |
| 2003 | US$ 7.681.620.390 | US$ 3.323.063.207 |
| 2002 | US$ 6.849.730.985 | US$ 2.884.414.192 |
| 2001 | US$ 6.861.760.295 | US$ 2.511.940.517 |
| 2000 | US$ 8.235.000.000 | US$ 2.256.850.026 |
| 1999 | US$ 6.798.203.826 | US$ 1.886.392.173 |
| 1998 | US$ 6.659.095.835 | US$ 1.384.886.253 |
| 1997 | US$ 6.579.989.219 | US$ 1.560.476.055 |
| 1996 | US$ 6.101.194.138 | US$ 1.535.847.164 |
| 1995 | US$ 5.998.536.585 | US$ 1.603.001.243 |
| 1994 | US$ 5.345.325.779 | US$ 1.079.617.531 |
| 1993 | US$ 4.481.456.954 | US$ 827.697.458 |
| 1992 | US$ 3.981.473.876 | - |
| 1991 | US$ 3.497.075.175 | - |
| 1990 | US$ 3.057.438.842 | - |
| 1989 | US$ 2.568.294.036 | - |
| 1988 | US$ 2.570.606.727 | - |
| 1987 | US$ 2.385.292.120 | - |
| 1986 | US$ 2.262.919.343 | - |
| 1985 | US$ 2.269.734.904 | - |
| 1984 | US$ 2.099.724.843 | - |
| 1983 | US$ 2.141.138.972 | - |
| 1982 | US$ 2.205.910.620 | - |
| 1981 | US$ 2.054.961.039 | - |
| 1980 | US$ 2.205.444.646 | - |
| 1979 | US$ 1.539.434.811 | - |
| 1978 | US$ 1.080.845.612 | - |
| 1977 | US$ 1.237.767.756 | - |
| 1976 | US$ 1.126.991.677 | - |
| 1975 | US$ 1.325.392.297 | - |
| 1974 | US$ 1.211.729.323 | - |
| 1973 | US$ 735.000.000 | - |
| 1972 | US$ 610.385.260 | - |
| 1971 | US$ 630.522.766 | - |
| 1970 | US$ 656.806.723 | - |
| 1969 | US$ 483.865.546 | - |
| 1968 | US$ 424.913.594 | - |
| 1967 | US$ 433.333.333 | - |
| 1966 | US$ 452.731.092 | - |
| 1965 | US$ 432.983.193 | - |
| 1964 | US$ 349.987.424 | - |
| 1963 | US$ 341.092.713 | - |
| 1962 | US$ 418.792.244 | - |
| 1961 | US$ 411.422.958 | - |
| 1960 | US$ 464.026.786 | - |
Em 2025, as importações de bens e serviços do Sri Lanka foram de US$ 24,9 bilhões e as do Camboja, de US$ 34,6 bilhões: as do Camboja foram 39% maiores. Em 1993, as importações do Sri Lanka foram 5,4 vezes maiores: US$ 4,48 bilhões do Sri Lanka e US$ 828 milhões do Camboja.
As importações de bens e serviços do Camboja têm sido maiores que as do Sri Lanka todos os anos desde 2020.
Sri Lanka vs Camboja: dados de importações
|
Sri Lanka
|
Camboja
|
|
|---|---|---|
| Importações | US$ 24,9 bi (2025) | US$ 34,6 bi (2025) |
| Posição mundial | 88/174 | 76/174 |
| Participação mundial | 0,07% | 0,1% |
| % do PIB | 22,8% | 67,4% |
| Maior categoria de bens | Máquinas, eletrônicos e veículos (25,7%, 2025) | Têxteis, roupas, calçados, móveis e brinquedos (25,5%, 2025) |
| Principal origem dos bens | China (24,3%, 2025) | China (53,1%, 2025) |
Comparar as importações de 2 países quaisquer
Fontes:
- Banco Mundial | Economy & Growth (1960–2025, atualizado em outubro de 2026)
- TradeMap (2001–2025, atualizado em outubro de 2026)
Creative Commons Atribuição (CC BY): você pode copiar, compartilhar, adaptar e reutilizar este conteúdo, inclusive para fins comerciais, desde que cite o statistics.wiki e indique as alterações que fizer. As fontes listadas acima podem ter suas próprias condições de licença.