
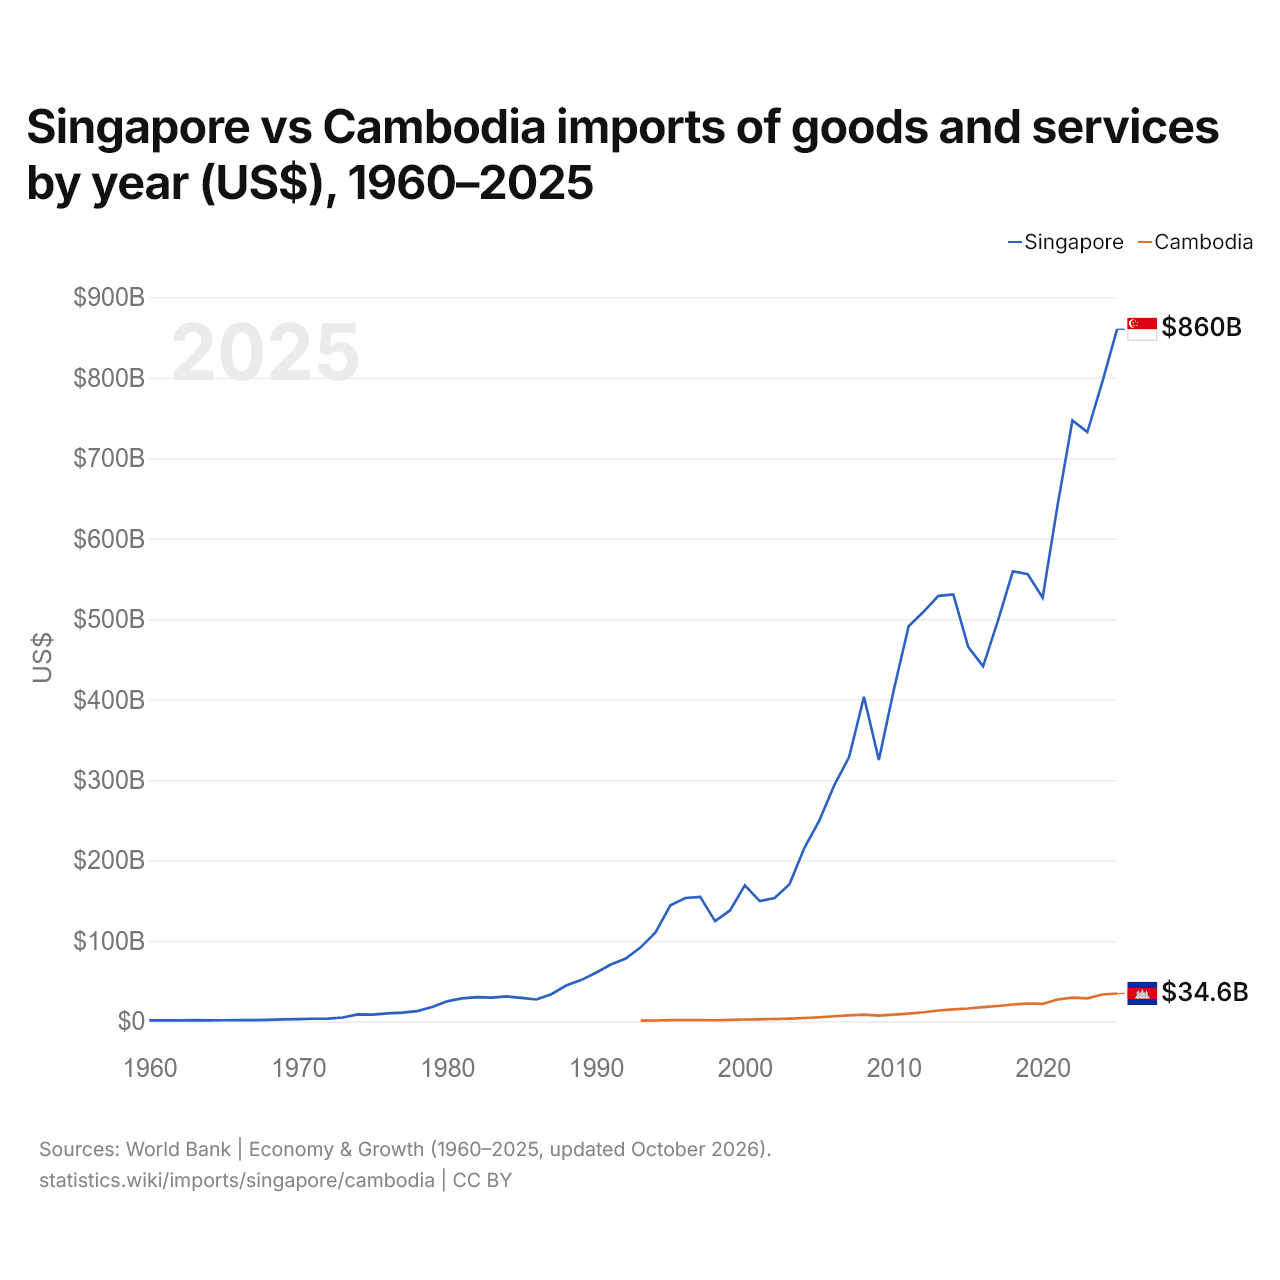
Singapura vs Camboja: importações de bens e serviços por ano (US$), 1960–2025
1x
| Ano | US$ | |
|---|---|---|
 Singapura |
 Camboja |
|
| 2025 | US$ 860.239.550.270 | US$ 34.576.163.751 |
| 2024 | US$ 794.257.214.124 | US$ 33.412.575.812 |
| 2023 | US$ 732.376.279.727 | US$ 28.497.892.006 |
| 2022 | US$ 746.881.154.042 | US$ 29.462.601.452 |
| 2021 | US$ 641.260.365.781 | US$ 27.158.061.718 |
| 2020 | US$ 526.490.604.765 | US$ 21.651.131.247 |
| 2019 | US$ 555.635.930.735 | US$ 22.117.532.079 |
| 2018 | US$ 559.453.294.011 | US$ 20.870.727.998 |
| 2017 | US$ 497.980.411.681 | US$ 19.038.733.852 |
| 2016 | US$ 441.180.387.768 | US$ 17.599.744.248 |
| 2015 | US$ 465.345.116.651 | US$ 15.985.986.398 |
| 2014 | US$ 530.588.532.418 | US$ 14.949.702.395 |
| 2013 | US$ 528.920.562.615 | US$ 13.521.734.447 |
| 2012 | US$ 509.015.616.848 | US$ 11.311.870.012 |
| 2011 | US$ 491.027.496.152 | US$ 9.598.623.051 |
| 2010 | US$ 411.718.156.402 | US$ 8.253.700.555 |
| 2009 | US$ 324.906.377.727 | US$ 7.011.246.138 |
| 2008 | US$ 403.368.670.138 | US$ 8.353.365.209 |
| 2007 | US$ 328.425.614.192 | US$ 7.349.164.263 |
| 2006 | US$ 293.279.955.794 | US$ 6.319.381.671 |
| 2005 | US$ 249.571.466.423 | US$ 5.123.916.348 |
| 2004 | US$ 215.770.830.917 | US$ 4.149.673.263 |
| 2003 | US$ 170.522.212.649 | US$ 3.323.063.207 |
| 2002 | US$ 153.298.972.181 | US$ 2.884.414.192 |
| 2001 | US$ 149.415.004.440 | US$ 2.511.940.517 |
| 2000 | US$ 169.107.805.678 | US$ 2.256.850.026 |
| 1999 | US$ 137.834.470.137 | US$ 1.886.392.173 |
| 1998 | US$ 124.555.957.749 | US$ 1.384.886.253 |
| 1997 | US$ 154.758.870.856 | US$ 1.560.476.055 |
| 1996 | US$ 153.364.122.036 | US$ 1.535.847.164 |
| 1995 | US$ 144.309.656.936 | US$ 1.603.001.243 |
| 1994 | US$ 110.550.174.016 | US$ 1.079.617.531 |
| 1993 | US$ 91.975.756.766 | US$ 827.697.458 |
| 1992 | US$ 77.981.321.905 | - |
| 1991 | US$ 70.627.959.479 | - |
| 1990 | US$ 60.411.526.432 | - |
| 1989 | US$ 51.266.199.563 | - |
| 1988 | US$ 44.438.888.889 | - |
| 1987 | US$ 33.687.287.591 | - |
| 1986 | US$ 27.154.402.073 | - |
| 1985 | US$ 29.103.089.400 | - |
| 1984 | US$ 30.939.233.318 | - |
| 1983 | US$ 29.571.682.243 | - |
| 1982 | US$ 30.107.256.118 | - |
| 1981 | US$ 28.576.639.268 | - |
| 1980 | US$ 24.854.915.847 | - |
| 1979 | US$ 17.695.118.734 | - |
| 1978 | US$ 12.716.323.686 | - |
| 1977 | US$ 10.869.354.055 | - |
| 1976 | US$ 9.896.765.487 | - |
| 1975 | US$ 8.250.441.134 | - |
| 1974 | US$ 8.589.077.887 | - |
| 1973 | US$ 4.708.693.333 | - |
| 1972 | US$ 3.328.711.443 | - |
| 1971 | US$ 3.165.523.324 | - |
| 1970 | US$ 2.785.458.085 | - |
| 1969 | US$ 2.349.945.447 | - |
| 1968 | US$ 1.869.679.409 | - |
| 1967 | US$ 1.505.968.209 | - |
| 1966 | US$ 1.430.834.765 | - |
| 1965 | US$ 1.308.987.920 | - |
| 1964 | US$ 1.188.741.743 | - |
| 1963 | US$ 1.428.972.762 | - |
| 1962 | US$ 1.227.157.800 | - |
| 1961 | US$ 1.200.305.760 | - |
| 1960 | US$ 1.243.752.491 | - |
Em 2025, as importações de bens e serviços de Singapura foram de US$ 860 bilhões e as do Camboja, de US$ 34,6 bilhões: as de Singapura foram 25 vezes maiores. Em 1993, as importações de Singapura foram 110 vezes maiores: US$ 92 bilhões de Singapura e US$ 828 milhões do Camboja.
As importações de bens e serviços de Singapura têm sido maiores que as do Camboja todos os anos desde 1993.
Singapura vs Camboja: dados de importações
|
Singapura
|
Camboja
|
|
|---|---|---|
| Importações | US$ 860 bi (2025) | US$ 34,6 bi (2025) |
| Posição mundial | 9/174 | 76/174 |
| Participação mundial | 2,55% | 0,1% |
| % do PIB | 142,5% | 67,4% |
| Maior categoria de bens | Máquinas, eletrônicos e veículos (61,2%, 2025) | Têxteis, roupas, calçados, móveis e brinquedos (25,5%, 2025) |
| Principal origem dos bens | China (12,5%, 2025) | China (53,1%, 2025) |
Comparar as importações de 2 países quaisquer
Fontes:
- Banco Mundial | Economy & Growth (1960–2025, atualizado em outubro de 2026)
- TradeMap (2001–2025, atualizado em outubro de 2026)
Creative Commons Atribuição (CC BY): você pode copiar, compartilhar, adaptar e reutilizar este conteúdo, inclusive para fins comerciais, desde que cite o statistics.wiki e indique as alterações que fizer. As fontes listadas acima podem ter suas próprias condições de licença.