
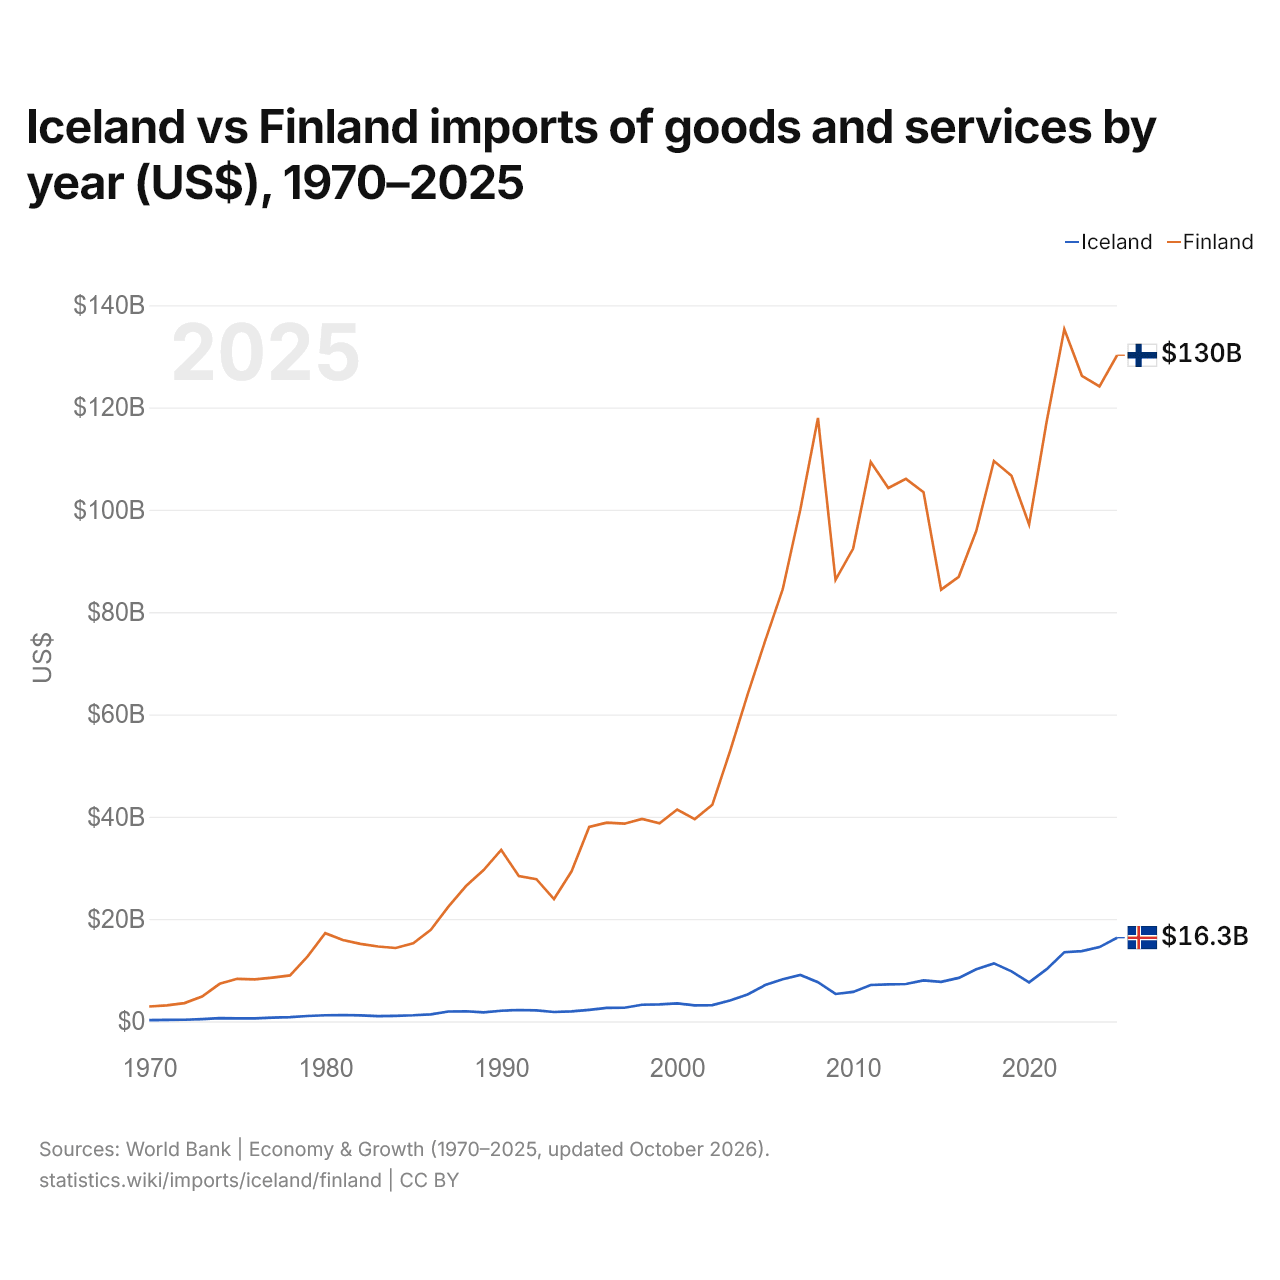
Islândia vs Finlândia: importações de bens e serviços por ano (US$), 1970–2025
1x
| Ano | US$ | |
|---|---|---|
 Islândia |
 Finlândia |
|
| 2025 | US$ 16.348.934.321 | US$ 130.205.696.940 |
| 2024 | US$ 14.510.626.908 | US$ 124.115.485.971 |
| 2023 | US$ 13.715.643.196 | US$ 126.181.886.286 |
| 2022 | US$ 13.505.975.928 | US$ 135.299.901.222 |
| 2021 | US$ 10.196.648.319 | US$ 117.299.452.992 |
| 2020 | US$ 7.605.549.122 | US$ 97.119.792.948 |
| 2019 | US$ 9.764.032.621 | US$ 106.661.292.345 |
| 2018 | US$ 11.328.152.833 | US$ 109.532.349.830 |
| 2017 | US$ 10.196.309.115 | US$ 95.883.949.215 |
| 2016 | US$ 8.490.620.818 | US$ 86.888.573.649 |
| 2015 | US$ 7.709.275.099 | US$ 84.376.236.306 |
| 2014 | US$ 8.010.515.430 | US$ 103.434.414.065 |
| 2013 | US$ 7.289.463.604 | US$ 106.039.600.487 |
| 2012 | US$ 7.210.160.315 | US$ 104.252.891.991 |
| 2011 | US$ 7.108.322.148 | US$ 109.358.964.446 |
| 2010 | US$ 5.755.787.173 | US$ 92.409.080.250 |
| 2009 | US$ 5.350.549.845 | US$ 86.296.583.224 |
| 2008 | US$ 7.661.403.285 | US$ 117.956.059.349 |
| 2007 | US$ 9.057.418.952 | US$ 100.068.194.989 |
| 2006 | US$ 8.231.507.894 | US$ 84.467.899.655 |
| 2005 | US$ 7.093.787.735 | US$ 74.385.401.475 |
| 2004 | US$ 5.256.645.900 | US$ 63.874.383.958 |
| 2003 | US$ 4.066.221.669 | US$ 52.757.320.690 |
| 2002 | US$ 3.160.502.456 | US$ 42.352.247.165 |
| 2001 | US$ 3.112.265.208 | US$ 39.524.131.051 |
| 2000 | US$ 3.520.829.004 | US$ 41.414.786.698 |
| 1999 | US$ 3.320.939.762 | US$ 38.733.513.445 |
| 1998 | US$ 3.241.180.130 | US$ 39.579.439.252 |
| 1997 | US$ 2.654.797.382 | US$ 38.637.040.431 |
| 1996 | US$ 2.621.869.173 | US$ 38.849.339.891 |
| 1995 | US$ 2.247.449.055 | US$ 37.987.472.767 |
| 1994 | US$ 1.933.731.893 | US$ 29.329.538.987 |
| 1993 | US$ 1.820.239.057 | US$ 23.895.076.507 |
| 1992 | US$ 2.126.363.946 | US$ 27.792.673.215 |
| 1991 | US$ 2.222.220.478 | US$ 28.389.942.655 |
| 1990 | US$ 2.067.695.843 | US$ 33.514.227.958 |
| 1989 | US$ 1.753.605.111 | US$ 29.576.001.108 |
| 1988 | US$ 1.970.826.754 | US$ 26.449.182.658 |
| 1987 | US$ 1.927.004.902 | US$ 22.422.561.883 |
| 1986 | US$ 1.369.556.639 | US$ 17.894.675.111 |
| 1985 | US$ 1.181.924.655 | US$ 15.264.773.599 |
| 1984 | US$ 1.077.216.892 | US$ 14.340.126.632 |
| 1983 | US$ 1.025.825.471 | US$ 14.637.062.340 |
| 1982 | US$ 1.169.312.796 | US$ 15.153.570.988 |
| 1981 | US$ 1.245.839.816 | US$ 15.896.941.306 |
| 1980 | US$ 1.185.819.785 | US$ 17.233.025.183 |
| 1979 | US$ 1.037.270.278 | US$ 12.688.139.215 |
| 1978 | US$ 832.986.611 | US$ 8.979.061.372 |
| 1977 | US$ 735.436.717 | US$ 8.555.407.998 |
| 1976 | US$ 563.608.168 | US$ 8.192.029.543 |
| 1975 | US$ 578.989.590 | US$ 8.310.974.624 |
| 1974 | US$ 615.641.821 | US$ 7.338.853.001 |
| 1973 | US$ 429.005.880 | US$ 4.849.296.717 |
| 1972 | US$ 305.401.088 | US$ 3.558.591.913 |
| 1971 | US$ 290.564.773 | US$ 3.116.111.111 |
| 1970 | US$ 225.194.318 | US$ 2.901.994.621 |
Em 2025, as importações de bens e serviços da Islândia foram de US$ 16,3 bilhões e as da Finlândia, de US$ 130 bilhões: as da Finlândia foram 8,0 vezes maiores. Em 1970, as importações da Finlândia foram 13 vezes maiores: US$ 225 milhões da Islândia e US$ 2,9 bilhões da Finlândia.
As importações de bens e serviços da Finlândia têm sido maiores que as da Islândia todos os anos desde 1970.
Islândia vs Finlândia: dados de importações
|
Islândia
|
Finlândia
|
|
|---|---|---|
| Importações | US$ 16,3 bi (2025) | US$ 130 bi (2025) |
| Posição mundial | 99/174 | 42/174 |
| Participação mundial | 0,05% | 0,39% |
| % do PIB | 42,4% | 41,1% |
| Maior categoria de bens | Máquinas, eletrônicos e veículos (44,6%, 2025) | Máquinas, eletrônicos e veículos (38,1%, 2025) |
| Principal origem dos bens | China (11,8%, 2025) | Alemanha (13,3%, 2025) |
Comparar as importações de 2 países quaisquer
Fontes:
- Banco Mundial | Economy & Growth (1970–2025, atualizado em outubro de 2026)
- TradeMap (2001–2025, atualizado em outubro de 2026)
Creative Commons Atribuição (CC BY): você pode copiar, compartilhar, adaptar e reutilizar este conteúdo, inclusive para fins comerciais, desde que cite o statistics.wiki e indique as alterações que fizer. As fontes listadas acima podem ter suas próprias condições de licença.