
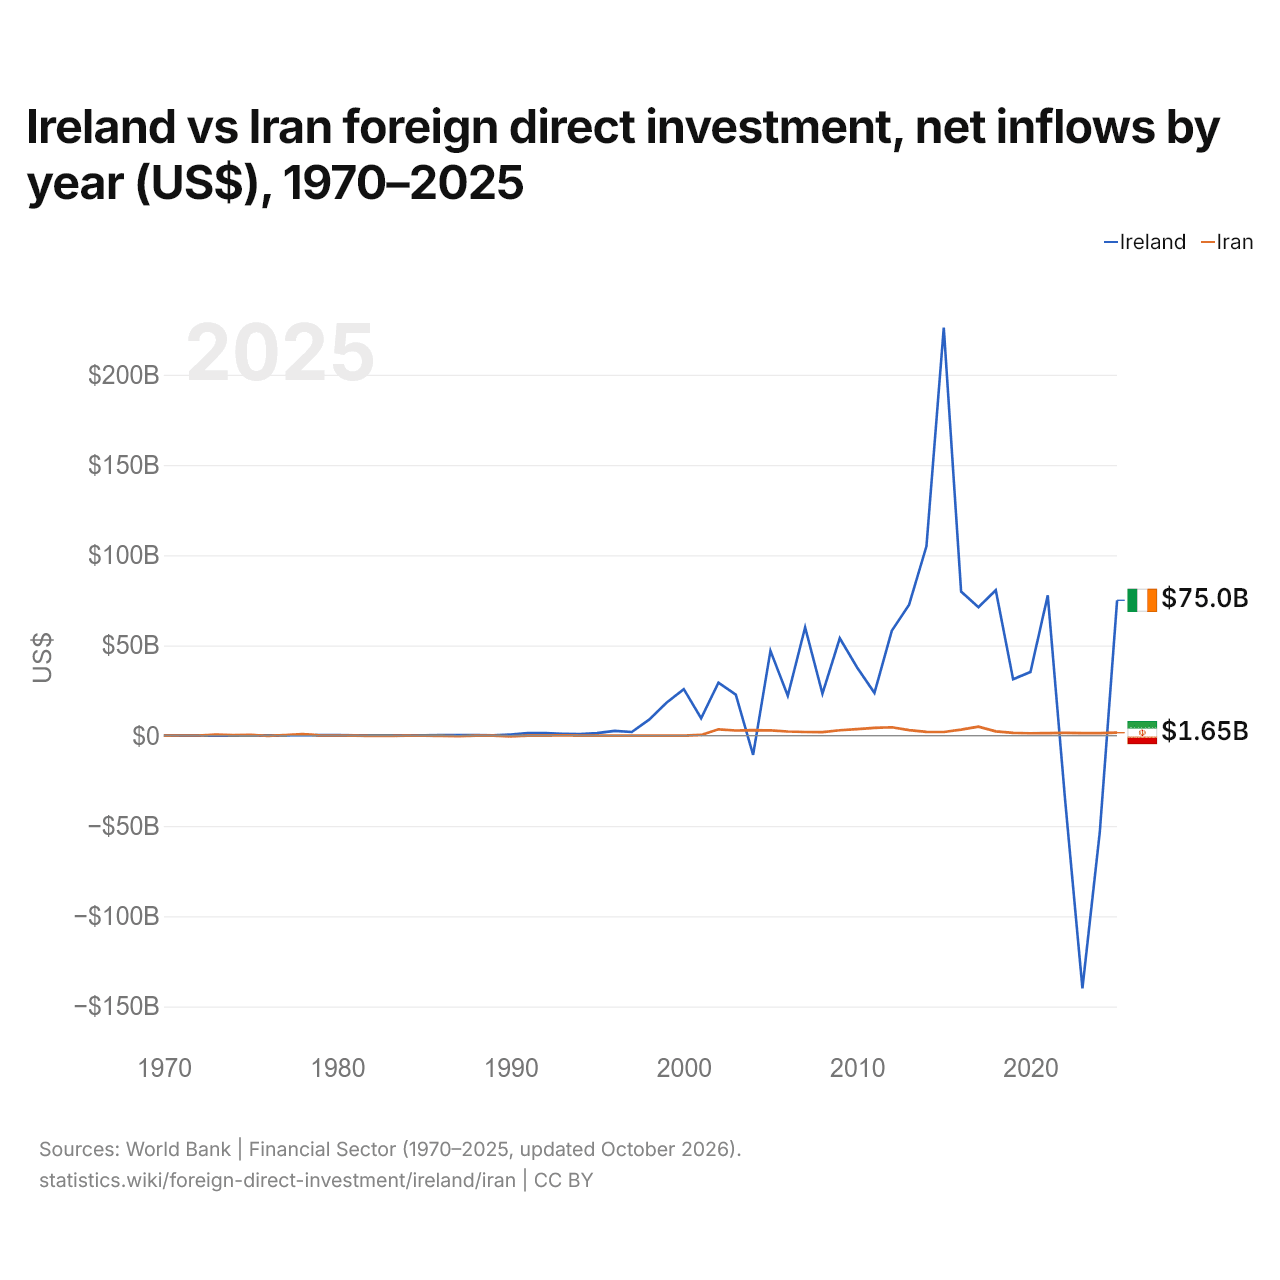
Irlanda vs Irã: investimento estrangeiro direto, entradas líquidas por ano (US$), 1970–2025
1x
| Ano | US$ | |
|---|---|---|
 Irlanda |
 Irã |
|
| 2025 | US$ 74.999.719.124 | US$ 1.646.577.407 |
| 2024 | US$ −53.563.388.768 | US$ 1.449.111.111 |
| 2023 | US$ −139.972.323.560 | US$ 1.422.333.333 |
| 2022 | US$ −35.575.910.808 | US$ 1.500.000.000 |
| 2021 | US$ 77.722.796.051 | US$ 1.425.000.000 |
| 2020 | US$ 35.288.206.770 | US$ 1.342.000.000 |
| 2019 | US$ 31.252.184.929 | US$ 1.508.000.000 |
| 2018 | US$ 80.581.468.517 | US$ 2.373.000.000 |
| 2017 | US$ 71.124.020.352 | US$ 5.019.000.000 |
| 2016 | US$ 79.795.011.378 | US$ 3.372.000.000 |
| 2015 | US$ 226.022.972.770 | US$ 2.050.000.000 |
| 2014 | US$ 104.903.896.348 | US$ 2.105.494.000 |
| 2013 | US$ 72.540.330.764 | US$ 3.049.945.000 |
| 2012 | US$ 58.090.414.123 | US$ 4.661.734.400 |
| 2011 | US$ 23.699.352.433 | US$ 4.276.718.690 |
| 2010 | US$ 37.748.455.284 | US$ 3.648.972.410 |
| 2009 | US$ 53.974.309.647 | US$ 2.983.421.910 |
| 2008 | US$ 23.287.686.336 | US$ 1.979.988.010 |
| 2007 | US$ 59.934.755.383 | US$ 2.017.791.750 |
| 2006 | US$ 22.070.063.905 | US$ 2.317.538.500 |
| 2005 | US$ 47.001.243.614 | US$ 2.889.191.670 |
| 2004 | US$ −10.607.612.697 | US$ 3.037.299.840 |
| 2003 | US$ 22.781.292.817 | US$ 2.877.481.500 |
| 2002 | US$ 29.323.796.527 | US$ 3.519.380.360 |
| 2001 | US$ 9.650.920.350 | US$ 408.118.760 |
| 2000 | US$ 25.779.436.153 | US$ 39.000.000 |
| 1999 | US$ 18.210.641.714 | US$ 35.000.000 |
| 1998 | US$ 8.862.216.911 | US$ 24.000.000 |
| 1997 | US$ 2.028.797.815 | US$ 53.000.000 |
| 1996 | US$ 2.617.483.000 | US$ 26.000.000 |
| 1995 | US$ 1.442.925.000 | US$ 17.000.000 |
| 1994 | US$ 856.979.000 | US$ 2.000.000 |
| 1993 | US$ 1.077.890.000 | US$ 207.550.000 |
| 1992 | US$ 1.458.175.000 | US$ 8.500.000 |
| 1991 | US$ 1.361.668.000 | US$ 22.590.000 |
| 1990 | US$ 621.911.000 | US$ −361.950.000 |
| 1989 | US$ 192.759.336 | US$ −19.420.000 |
| 1988 | US$ 257.438.683 | US$ 60.540.000 |
| 1987 | US$ 322.476.620 | US$ −307.630.000 |
| 1986 | US$ 250.293.355 | US$ −112.440.000 |
| 1985 | US$ 163.660.000 | US$ −38.150.000 |
| 1984 | US$ 121.360.000 | US$ 42.690.000 |
| 1983 | US$ 169.650.000 | US$ −78.520.000 |
| 1982 | US$ 242.010.000 | US$ −136.090.000 |
| 1981 | US$ 203.450.000 | US$ 28.220.000 |
| 1980 | US$ 286.450.000 | US$ 80.910.000 |
| 1979 | US$ 336.680.000 | US$ 164.350.000 |
| 1978 | US$ 375.260.000 | US$ 909.060.000 |
| 1977 | US$ 136.240.000 | US$ 345.690.000 |
| 1976 | US$ 172.680.000 | US$ −101.590.000 |
| 1975 | US$ 158.170.000 | US$ 494.400.000 |
| 1974 | US$ 51.200.000 | US$ 323.500.000 |
| 1973 | US$ 52.000.000 | US$ 561.500.000 |
| 1972 | US$ 31.000.000 | US$ 91.200.000 |
| 1971 | US$ 25.000.000 | US$ 65.200.000 |
| 1970 | US$ 32.000.000 | US$ 28.000.000 |
Em 2025, as entradas líquidas de investimento estrangeiro direto foram de US$ 75 bilhões na Irlanda e de US$ 1,65 bilhão no Irã: 46 vezes mais na Irlanda. Em 1970, foram de US$ 32 milhões na Irlanda e de US$ 28 milhões no Irã.
As entradas líquidas de investimento estrangeiro direto na Irlanda foram maiores que no Irã em 45 dos 56 anos de 1970 a 2025, e menores em 11.
Irlanda vs Irã: entradas e saídas mais recentes de investimento estrangeiro
|
Irlanda
|
Irã
|
|
|---|---|---|
| Entradas líquidas | +US$ 75,0 bi | +US$ 1,65 bi |
| Entradas líquidas, % do PIB | +10,4% | +0,5% |
| Saídas líquidas | +US$ 86,4 bi | +US$ 104 mi |
| Entradas líquidas, total 2016–2025 | +US$ 222 bi | +US$ 21,1 bi |
| Posição mundial | 6/192 | 78/192 |
Comparar o investimento estrangeiro direto de 2 países quaisquer
Fontes:
- Banco Mundial | Financial Sector (1970–2025, atualizado em outubro de 2026)
Creative Commons Atribuição (CC BY): você pode copiar, compartilhar, adaptar e reutilizar este conteúdo, inclusive para fins comerciais, desde que cite o statistics.wiki e indique as alterações que fizer. As fontes listadas acima podem ter suas próprias condições de licença.