
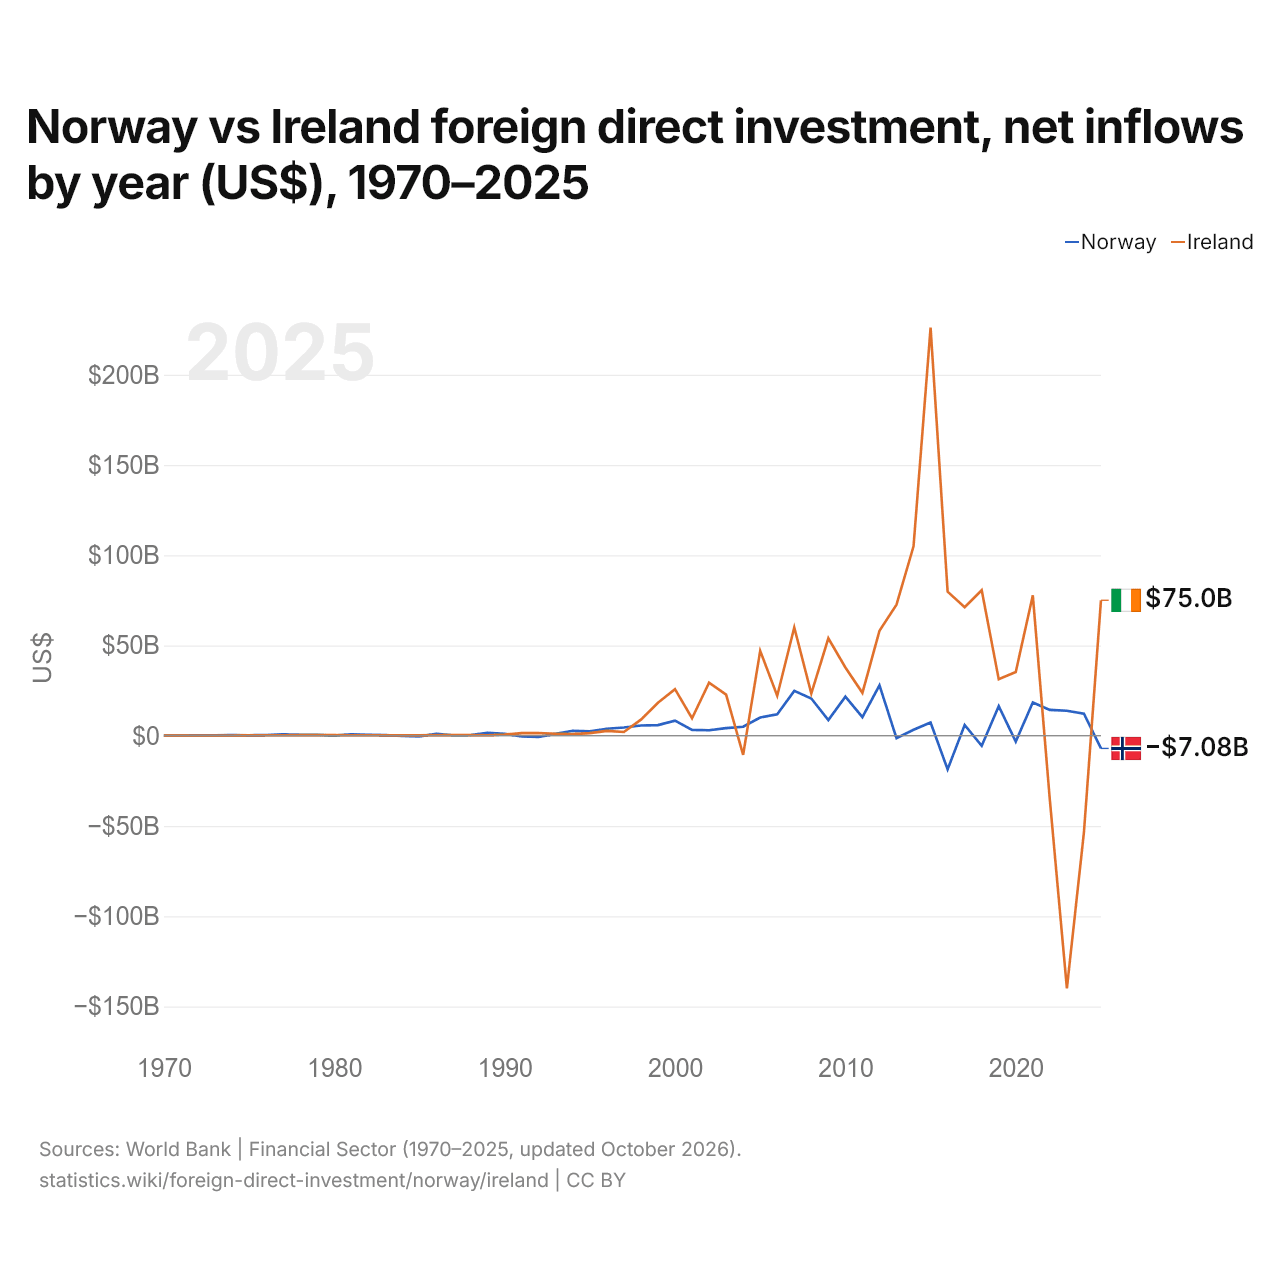
Noruega vs Irlanda: investimento estrangeiro direto, entradas líquidas por ano (US$), 1970–2025
1x
| Ano | US$ | |
|---|---|---|
 Noruega |
 Irlanda |
|
| 2025 | US$ −7.079.264.326 | US$ 74.999.719.124 |
| 2024 | US$ 12.133.906.455 | US$ −53.563.388.768 |
| 2023 | US$ 13.785.279.525 | US$ −139.972.323.560 |
| 2022 | US$ 14.278.134.699 | US$ −35.575.910.808 |
| 2021 | US$ 18.355.008.694 | US$ 77.722.796.051 |
| 2020 | US$ −3.281.320.957 | US$ 35.288.206.770 |
| 2019 | US$ 16.329.824.318 | US$ 31.252.184.929 |
| 2018 | US$ −5.664.319.362 | US$ 80.581.468.517 |
| 2017 | US$ 5.900.604.724 | US$ 71.124.020.352 |
| 2016 | US$ −18.668.572.814 | US$ 79.795.011.378 |
| 2015 | US$ 7.274.086.872 | US$ 226.022.972.770 |
| 2014 | US$ 3.242.240.088 | US$ 104.903.896.348 |
| 2013 | US$ −1.368.607.171 | US$ 72.540.330.764 |
| 2012 | US$ 27.897.968.328 | US$ 58.090.414.123 |
| 2011 | US$ 10.296.323.076 | US$ 23.699.352.433 |
| 2010 | US$ 21.634.265.663 | US$ 37.748.455.284 |
| 2009 | US$ 8.635.762.892 | US$ 53.974.309.647 |
| 2008 | US$ 20.578.219.685 | US$ 23.287.686.336 |
| 2007 | US$ 24.806.091.103 | US$ 59.934.755.383 |
| 2006 | US$ 11.877.923.790 | US$ 22.070.063.905 |
| 2005 | US$ 10.058.759.830 | US$ 47.001.243.614 |
| 2004 | US$ 4.918.494.986 | US$ −10.607.612.697 |
| 2003 | US$ 4.179.380.423 | US$ 22.781.292.817 |
| 2002 | US$ 3.011.752.930 | US$ 29.323.796.527 |
| 2001 | US$ 3.190.216.069 | US$ 9.650.920.350 |
| 2000 | US$ 8.332.062.186 | US$ 25.779.436.153 |
| 1999 | US$ 5.822.113.546 | US$ 18.210.641.714 |
| 1998 | US$ 5.645.870.321 | US$ 8.862.216.911 |
| 1997 | US$ 4.514.609.380 | US$ 2.028.797.815 |
| 1996 | US$ 3.827.495.491 | US$ 2.617.483.000 |
| 1995 | US$ 2.392.766.980 | US$ 1.442.925.000 |
| 1994 | US$ 2.736.393.920 | US$ 856.979.000 |
| 1993 | US$ 991.524.095 | US$ 1.077.890.000 |
| 1992 | US$ −668.114.803 | US$ 1.458.175.000 |
| 1991 | US$ −353.675.744 | US$ 1.361.668.000 |
| 1990 | US$ 1.001.987.072 | US$ 621.911.000 |
| 1989 | US$ 1.510.287.425 | US$ 192.759.336 |
| 1988 | US$ 280.910.587 | US$ 257.438.683 |
| 1987 | US$ 190.047.506 | US$ 322.476.620 |
| 1986 | US$ 1.018.718.112 | US$ 250.293.355 |
| 1985 | US$ −424.225.257 | US$ 163.660.000 |
| 1984 | US$ −177.399.976 | US$ 121.360.000 |
| 1983 | US$ 332.396.808 | US$ 169.650.000 |
| 1982 | US$ 450.026.120 | US$ 242.010.000 |
| 1981 | US$ 668.006.461 | US$ 203.450.000 |
| 1980 | US$ 59.815.998 | US$ 286.450.000 |
| 1979 | US$ 401.356.278 | US$ 336.680.000 |
| 1978 | US$ 489.814.168 | US$ 375.260.000 |
| 1977 | US$ 768.296.210 | US$ 136.240.000 |
| 1976 | US$ 371.391.272 | US$ 172.680.000 |
| 1975 | US$ 219.677.310 | US$ 158.170.000 |
| 1974 | US$ 346.000.000 | US$ 51.200.000 |
| 1973 | US$ 209.000.000 | US$ 52.000.000 |
| 1972 | US$ 121.000.000 | US$ 31.000.000 |
| 1971 | US$ 94.000.000 | US$ 25.000.000 |
| 1970 | US$ 64.000.000 | US$ 32.000.000 |
Em 2025, as entradas líquidas de investimento estrangeiro direto foram negativas na Noruega, de US$ 7,08 bilhões e de US$ 75 bilhões na Irlanda. Em 1970, foram de US$ 64 milhões na Noruega e de US$ 32 milhões na Irlanda.
As entradas líquidas de investimento estrangeiro direto na Noruega foram maiores que na Irlanda em 25 dos 56 anos de 1970 a 2025, e menores em 31.
Noruega vs Irlanda: entradas e saídas mais recentes de investimento estrangeiro
|
Noruega
|
Irlanda
|
|
|---|---|---|
| Entradas líquidas | -US$ 7,08 bi | +US$ 75,0 bi |
| Entradas líquidas, % do PIB | −1,3% | +10,4% |
| Saídas líquidas | +US$ 3,37 bi | +US$ 86,4 bi |
| Entradas líquidas, total 2016–2025 | +US$ 46,1 bi | +US$ 222 bi |
| Posição mundial | 187/192 | 6/192 |
Comparar o investimento estrangeiro direto de 2 países quaisquer
Fontes:
- Banco Mundial | Financial Sector (1970–2025, atualizado em outubro de 2026)
Creative Commons Atribuição (CC BY): você pode copiar, compartilhar, adaptar e reutilizar este conteúdo, inclusive para fins comerciais, desde que cite o statistics.wiki e indique as alterações que fizer. As fontes listadas acima podem ter suas próprias condições de licença.