
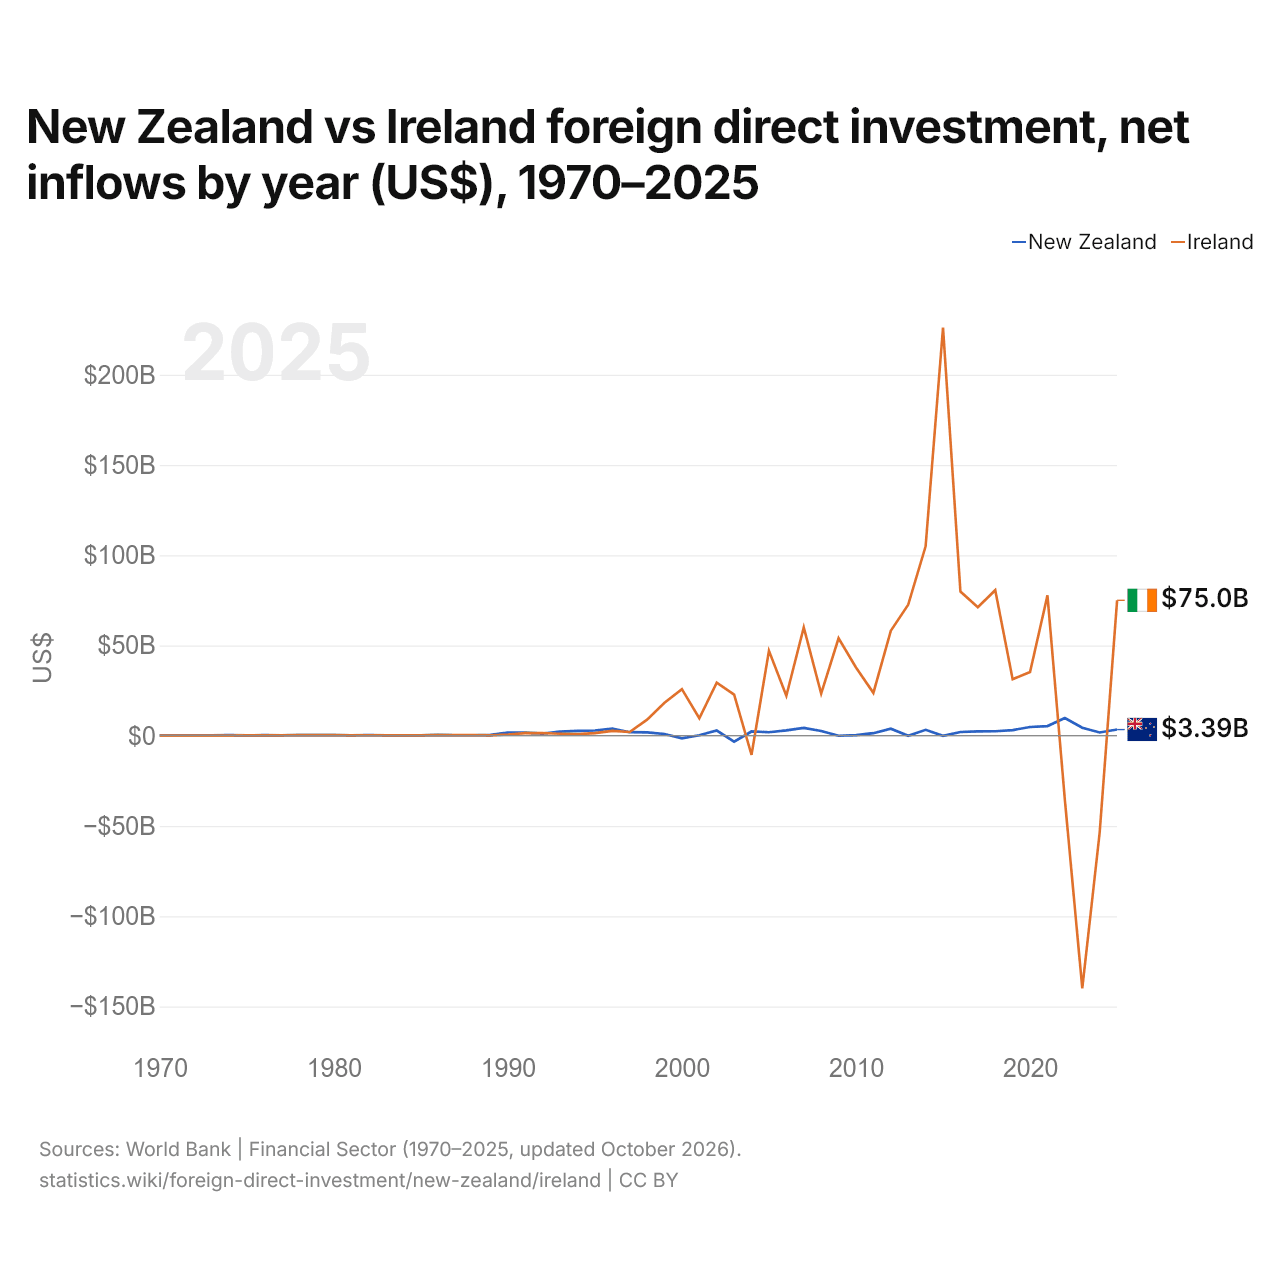
Nova Zelândia vs Irlanda: investimento estrangeiro direto, entradas líquidas por ano (US$), 1970–2025
1x
| Ano | US$ | |
|---|---|---|
 Nova Zelândia |
 Irlanda |
|
| 2025 | US$ 3.393.445.046 | US$ 74.999.719.124 |
| 2024 | US$ 1.759.833.655 | US$ −53.563.388.768 |
| 2023 | US$ 4.394.895.399 | US$ −139.972.323.560 |
| 2022 | US$ 9.806.744.153 | US$ −35.575.910.808 |
| 2021 | US$ 5.304.581.495 | US$ 77.722.796.051 |
| 2020 | US$ 4.800.458.072 | US$ 35.288.206.770 |
| 2019 | US$ 3.074.896.212 | US$ 31.252.184.929 |
| 2018 | US$ 2.456.550.920 | US$ 80.581.468.517 |
| 2017 | US$ 2.390.035.935 | US$ 71.124.020.352 |
| 2016 | US$ 2.008.111.275 | US$ 79.795.011.378 |
| 2015 | US$ −73.372.796 | US$ 226.022.972.770 |
| 2014 | US$ 3.251.563.602 | US$ 104.903.896.348 |
| 2013 | US$ −69.519.935 | US$ 72.540.330.764 |
| 2012 | US$ 3.846.884.019 | US$ 58.090.414.123 |
| 2011 | US$ 1.378.410.924 | US$ 23.699.352.433 |
| 2010 | US$ 286.306.903 | US$ 37.748.455.284 |
| 2009 | US$ −52.385.533 | US$ 53.974.309.647 |
| 2008 | US$ 2.591.966.537 | US$ 23.287.686.336 |
| 2007 | US$ 4.335.506.076 | US$ 59.934.755.383 |
| 2006 | US$ 2.912.645.687 | US$ 22.070.063.905 |
| 2005 | US$ 1.906.665.964 | US$ 47.001.243.614 |
| 2004 | US$ 2.319.819.298 | US$ −10.607.612.697 |
| 2003 | US$ −3.363.941.288 | US$ 22.781.292.817 |
| 2002 | US$ 2.848.556.987 | US$ 29.323.796.527 |
| 2001 | US$ 259.321.577 | US$ 9.650.920.350 |
| 2000 | US$ −1.507.812.033 | US$ 25.779.436.153 |
| 1999 | US$ 941.464.112 | US$ 18.210.641.714 |
| 1998 | US$ 1.825.772.782 | US$ 8.862.216.911 |
| 1997 | US$ 1.917.456.791 | US$ 2.028.797.815 |
| 1996 | US$ 3.918.617.040 | US$ 2.617.483.000 |
| 1995 | US$ 2.849.961.939 | US$ 1.442.925.000 |
| 1994 | US$ 2.616.630.695 | US$ 856.979.000 |
| 1993 | US$ 2.211.822.687 | US$ 1.077.890.000 |
| 1992 | US$ 1.088.200.066 | US$ 1.458.175.000 |
| 1991 | US$ 1.691.366.072 | US$ 1.361.668.000 |
| 1990 | US$ 1.684.763.155 | US$ 621.911.000 |
| 1989 | US$ 433.573.543 | US$ 192.759.336 |
| 1988 | US$ 155.922.432 | US$ 257.438.683 |
| 1987 | US$ 237.229.723 | US$ 322.476.620 |
| 1986 | US$ 389.408.100 | US$ 250.293.355 |
| 1985 | US$ 225.366.591 | US$ 163.660.000 |
| 1984 | US$ 116.213.811 | US$ 121.360.000 |
| 1983 | US$ 243.190.337 | US$ 169.650.000 |
| 1982 | US$ 274.648.997 | US$ 242.010.000 |
| 1981 | US$ 176.961.979 | US$ 203.450.000 |
| 1980 | US$ 334.086.570 | US$ 286.450.000 |
| 1979 | US$ 350.540.000 | US$ 336.680.000 |
| 1978 | US$ 273.740.000 | US$ 375.260.000 |
| 1977 | US$ 154.320.000 | US$ 136.240.000 |
| 1976 | US$ 277.640.000 | US$ 172.680.000 |
| 1975 | US$ 138.170.000 | US$ 158.170.000 |
| 1974 | US$ 251.610.000 | US$ 51.200.000 |
| 1973 | US$ 207.650.000 | US$ 52.000.000 |
| 1972 | US$ 126.690.000 | US$ 31.000.000 |
| 1971 | US$ 110.000.000 | US$ 25.000.000 |
| 1970 | US$ 146.000.000 | US$ 32.000.000 |
Em 2025, as entradas líquidas de investimento estrangeiro direto foram de US$ 3,39 bilhões na Nova Zelândia e de US$ 75 bilhões na Irlanda: 22 vezes mais na Irlanda. Em 1970, foram de US$ 146 milhões na Nova Zelândia e de US$ 32 milhões na Irlanda.
As entradas líquidas de investimento estrangeiro direto na Nova Zelândia foram maiores que na Irlanda em 24 dos 56 anos de 1970 a 2025, e menores em 32.
Nova Zelândia vs Irlanda: entradas e saídas mais recentes de investimento estrangeiro
|
Nova Zelândia
|
Irlanda
|
|
|---|---|---|
| Entradas líquidas | +US$ 3,39 bi | +US$ 75,0 bi |
| Entradas líquidas, % do PIB | +1,3% | +10,4% |
| Saídas líquidas | +US$ 43,9 mi | +US$ 86,4 bi |
| Entradas líquidas, total 2016–2025 | +US$ 39,4 bi | +US$ 222 bi |
| Posição mundial | 54/192 | 6/192 |
Comparar o investimento estrangeiro direto de 2 países quaisquer
Fontes:
- Banco Mundial | Financial Sector (1970–2025, atualizado em outubro de 2026)
Creative Commons Atribuição (CC BY): você pode copiar, compartilhar, adaptar e reutilizar este conteúdo, inclusive para fins comerciais, desde que cite o statistics.wiki e indique as alterações que fizer. As fontes listadas acima podem ter suas próprias condições de licença.