
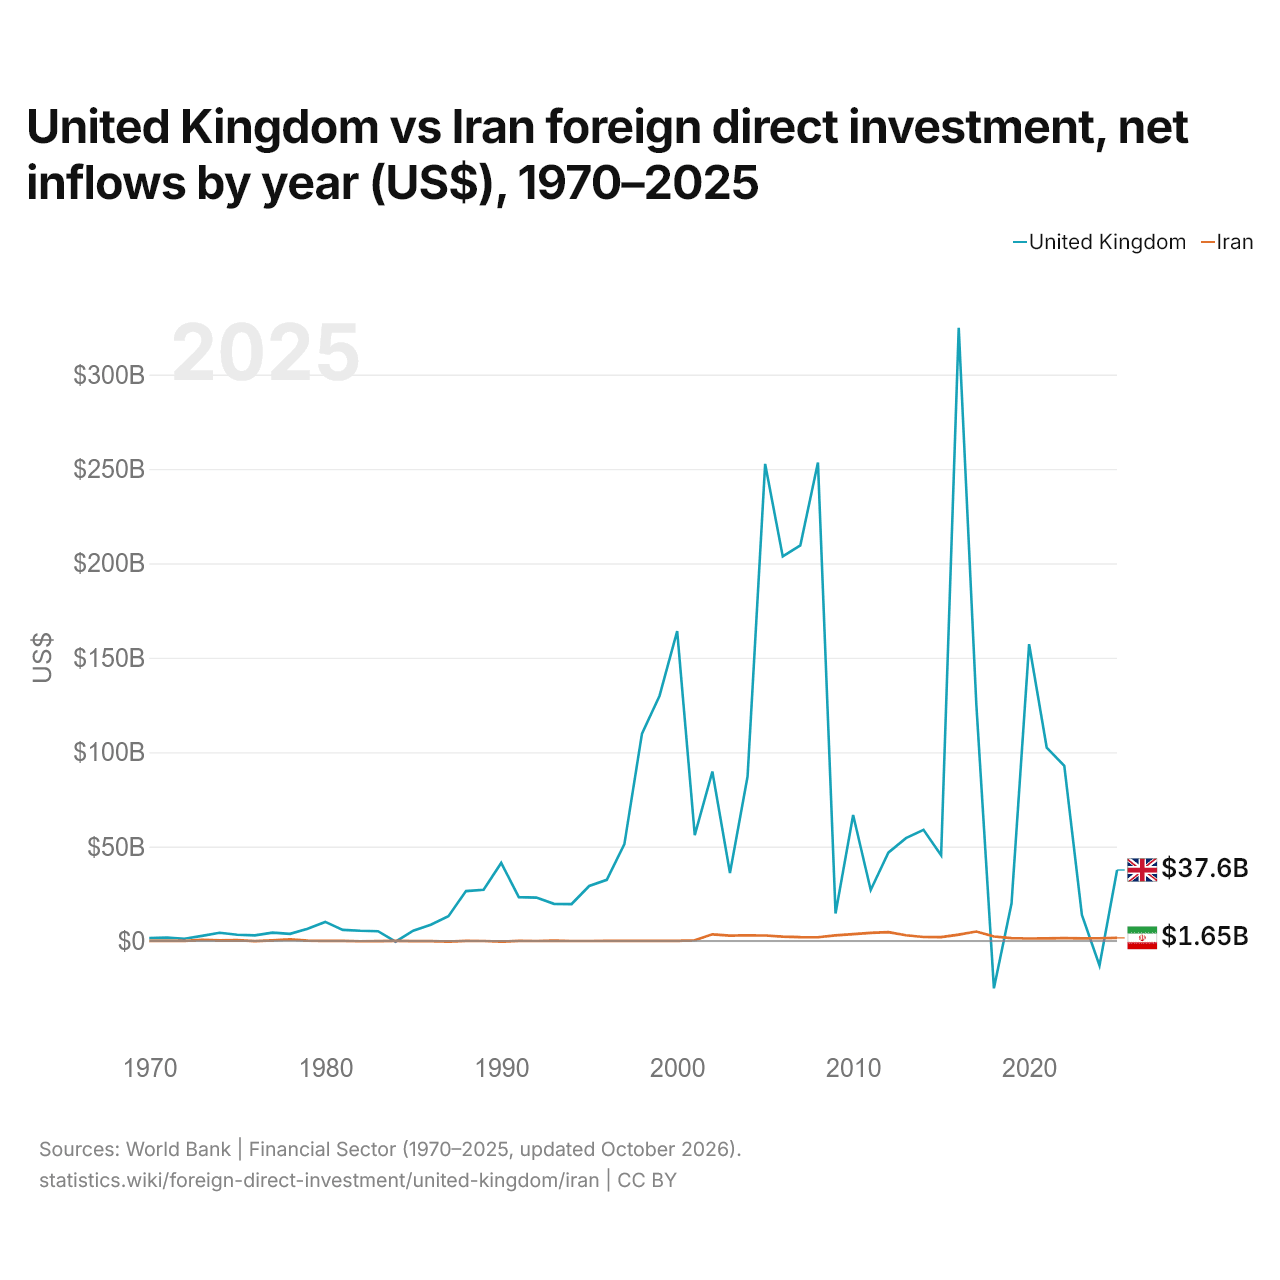
Reino Unido vs Irã: investimento estrangeiro direto, entradas líquidas por ano (US$), 1970–2025
1x
| Ano | US$ | |
|---|---|---|
 Reino Unido |
 Irã |
|
| 2025 | US$ 37.588.831.511 | US$ 1.646.577.407 |
| 2024 | US$ −12.955.141.485 | US$ 1.449.111.111 |
| 2023 | US$ 13.789.803.776 | US$ 1.422.333.333 |
| 2022 | US$ 92.776.358.059 | US$ 1.500.000.000 |
| 2021 | US$ 102.431.564.639 | US$ 1.425.000.000 |
| 2020 | US$ 157.185.559.300 | US$ 1.342.000.000 |
| 2019 | US$ 19.790.761.929 | US$ 1.508.000.000 |
| 2018 | US$ −25.055.440.307 | US$ 2.373.000.000 |
| 2017 | US$ 125.358.809.934 | US$ 5.019.000.000 |
| 2016 | US$ 324.813.224.213 | US$ 3.372.000.000 |
| 2015 | US$ 45.333.483.122 | US$ 2.050.000.000 |
| 2014 | US$ 58.890.445.253 | US$ 2.105.494.000 |
| 2013 | US$ 54.473.175.400 | US$ 3.049.945.000 |
| 2012 | US$ 46.750.789.728 | US$ 4.661.734.400 |
| 2011 | US$ 27.012.050.072 | US$ 4.276.718.690 |
| 2010 | US$ 66.734.551.294 | US$ 3.648.972.410 |
| 2009 | US$ 14.547.108.445 | US$ 2.983.421.910 |
| 2008 | US$ 253.454.117.907 | US$ 1.979.988.010 |
| 2007 | US$ 209.514.959.647 | US$ 2.017.791.750 |
| 2006 | US$ 203.636.431.868 | US$ 2.317.538.500 |
| 2005 | US$ 252.653.397.148 | US$ 2.889.191.670 |
| 2004 | US$ 87.059.621.382 | US$ 3.037.299.840 |
| 2003 | US$ 36.011.240.473 | US$ 2.877.481.500 |
| 2002 | US$ 89.760.582.753 | US$ 3.519.380.360 |
| 2001 | US$ 56.090.924.809 | US$ 408.118.760 |
| 2000 | US$ 164.130.335.444 | US$ 39.000.000 |
| 1999 | US$ 129.891.584.490 | US$ 35.000.000 |
| 1998 | US$ 109.817.612.847 | US$ 24.000.000 |
| 1997 | US$ 51.311.836.384 | US$ 53.000.000 |
| 1996 | US$ 32.412.668.835 | US$ 26.000.000 |
| 1995 | US$ 29.129.258.041 | US$ 17.000.000 |
| 1994 | US$ 19.561.337.402 | US$ 2.000.000 |
| 1993 | US$ 19.686.257.927 | US$ 207.550.000 |
| 1992 | US$ 23.011.210.834 | US$ 8.500.000 |
| 1991 | US$ 23.244.186.242 | US$ 22.590.000 |
| 1990 | US$ 41.363.405.439 | US$ −361.950.000 |
| 1989 | US$ 27.108.240.789 | US$ −19.420.000 |
| 1988 | US$ 26.430.921.298 | US$ 60.540.000 |
| 1987 | US$ 13.074.923.702 | US$ −307.630.000 |
| 1986 | US$ 8.569.621.722 | US$ −112.440.000 |
| 1985 | US$ 5.476.472.897 | US$ −38.150.000 |
| 1984 | US$ −347.322.545 | US$ 42.690.000 |
| 1983 | US$ 5.178.781.726 | US$ −78.520.000 |
| 1982 | US$ 5.413.259.759 | US$ −136.090.000 |
| 1981 | US$ 5.879.375.698 | US$ 28.220.000 |
| 1980 | US$ 10.122.844.316 | US$ 80.910.000 |
| 1979 | US$ 6.469.481.160 | US$ 164.350.000 |
| 1978 | US$ 3.787.370.849 | US$ 909.060.000 |
| 1977 | US$ 4.426.545.754 | US$ 345.690.000 |
| 1976 | US$ 3.006.207.709 | US$ −101.590.000 |
| 1975 | US$ 3.318.535.790 | US$ 494.400.000 |
| 1974 | US$ 4.373.743.380 | US$ 323.500.000 |
| 1973 | US$ 2.722.732.320 | US$ 561.500.000 |
| 1972 | US$ 1.207.963.191 | US$ 91.200.000 |
| 1971 | US$ 1.771.224.349 | US$ 65.200.000 |
| 1970 | US$ 1.487.998.812 | US$ 28.000.000 |
Em 2025, as entradas líquidas de investimento estrangeiro direto foram de US$ 37,6 bilhões no Reino Unido e de US$ 1,65 bilhão no Irã: 23 vezes mais no Reino Unido. Em 1970, foram de US$ 1,49 bilhão no Reino Unido e de US$ 28 milhões no Irã.
As entradas líquidas de investimento estrangeiro direto no Reino Unido foram maiores que no Irã em 53 dos 56 anos de 1970 a 2025, e menores em 3.
Reino Unido vs Irã: entradas e saídas mais recentes de investimento estrangeiro
|
Reino Unido
|
Irã
|
|
|---|---|---|
| Entradas líquidas | +US$ 37,6 bi | +US$ 1,65 bi |
| Entradas líquidas, % do PIB | +0,9% | +0,5% |
| Saídas líquidas | +US$ 9,43 bi | +US$ 104 mi |
| Entradas líquidas, total 2016–2025 | +US$ 836 bi | +US$ 21,1 bi |
| Posição mundial | 13/192 | 78/192 |
Comparar o investimento estrangeiro direto de 2 países quaisquer
Fontes:
- Banco Mundial | Financial Sector (1970–2025, atualizado em outubro de 2026)
Creative Commons Atribuição (CC BY): você pode copiar, compartilhar, adaptar e reutilizar este conteúdo, inclusive para fins comerciais, desde que cite o statistics.wiki e indique as alterações que fizer. As fontes listadas acima podem ter suas próprias condições de licença.