
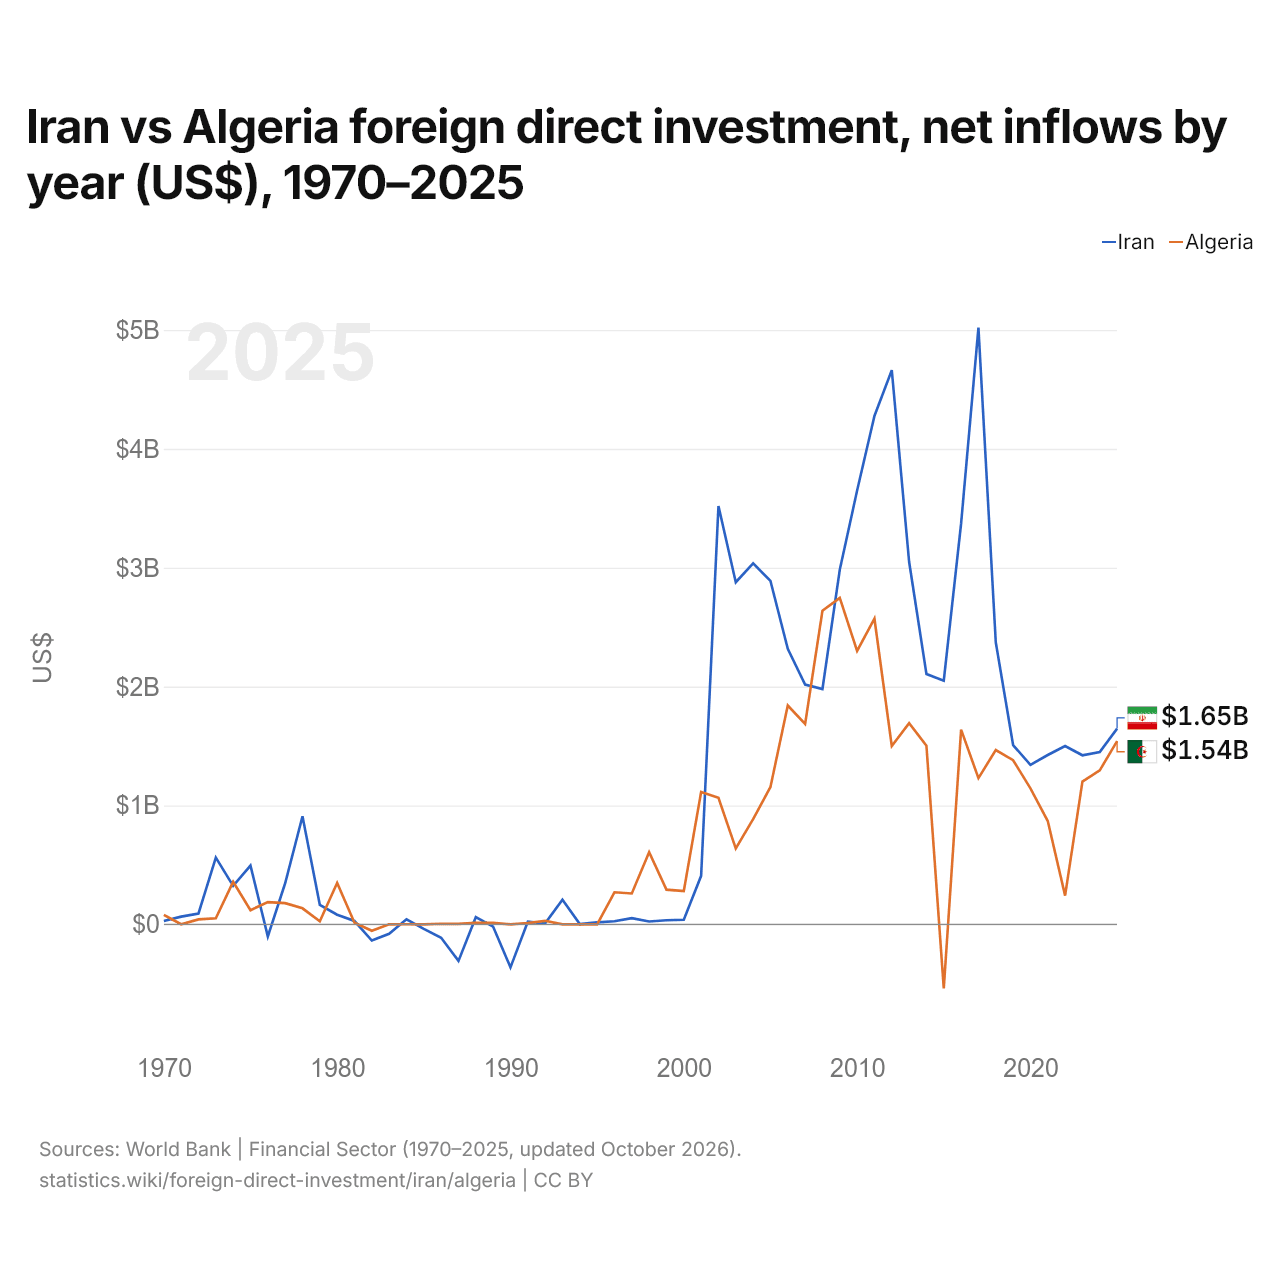
Irã vs Argélia: investimento estrangeiro direto, entradas líquidas por ano (US$), 1970–2025
| Ano | US$ | |
|---|---|---|
 Irã |
 Argélia |
|
| 2025 | US$ 1.646.577.407 | US$ 1.541.664.825 |
| 2024 | US$ 1.449.111.111 | US$ 1.295.537.014 |
| 2023 | US$ 1.422.333.333 | US$ 1.201.490.230 |
| 2022 | US$ 1.500.000.000 | US$ 241.796.030 |
| 2021 | US$ 1.425.000.000 | US$ 869.194.073 |
| 2020 | US$ 1.342.000.000 | US$ 1.143.918.160 |
| 2019 | US$ 1.508.000.000 | US$ 1.381.200.050 |
| 2018 | US$ 2.373.000.000 | US$ 1.466.116.068 |
| 2017 | US$ 5.019.000.000 | US$ 1.230.243.451 |
| 2016 | US$ 3.372.000.000 | US$ 1.638.263.954 |
| 2015 | US$ 2.050.000.000 | US$ −537.792.921 |
| 2014 | US$ 2.105.494.000 | US$ 1.502.206.171 |
| 2013 | US$ 3.049.945.000 | US$ 1.691.886.708 |
| 2012 | US$ 4.661.734.400 | US$ 1.500.402.453 |
| 2011 | US$ 4.276.718.690 | US$ 2.571.237.025 |
| 2010 | US$ 3.648.972.410 | US$ 2.300.369.124 |
| 2009 | US$ 2.983.421.910 | US$ 2.746.930.734 |
| 2008 | US$ 1.979.988.010 | US$ 2.638.607.034 |
| 2007 | US$ 2.017.791.750 | US$ 1.686.736.540 |
| 2006 | US$ 2.317.538.500 | US$ 1.841.000.000 |
| 2005 | US$ 2.889.191.670 | US$ 1.156.000.000 |
| 2004 | US$ 3.037.299.840 | US$ 884.749.028 |
| 2003 | US$ 2.877.481.500 | US$ 637.853.027 |
| 2002 | US$ 3.519.380.360 | US$ 1.064.960.000 |
| 2001 | US$ 408.118.760 | US$ 1.113.105.541 |
| 2000 | US$ 39.000.000 | US$ 280.100.000 |
| 1999 | US$ 35.000.000 | US$ 291.600.000 |
| 1998 | US$ 24.000.000 | US$ 606.600.000 |
| 1997 | US$ 53.000.000 | US$ 260.000.000 |
| 1996 | US$ 26.000.000 | US$ 270.000.000 |
| 1995 | US$ 17.000.000 | US$ 1.000 |
| 1994 | US$ 2.000.000 | US$ 1.000 |
| 1993 | US$ 207.550.000 | US$ 1.000 |
| 1992 | US$ 8.500.000 | US$ 30.000.000 |
| 1991 | US$ 22.590.000 | US$ 11.638.686 |
| 1990 | US$ −361.950.000 | US$ 334.915 |
| 1989 | US$ −19.420.000 | US$ 12.091.647 |
| 1988 | US$ 60.540.000 | US$ 13.018.265 |
| 1987 | US$ −307.630.000 | US$ 3.711.538 |
| 1986 | US$ −112.440.000 | US$ 5.316.528 |
| 1985 | US$ −38.150.000 | US$ 397.788 |
| 1984 | US$ 42.690.000 | US$ 802.669 |
| 1983 | US$ −78.520.000 | US$ 417.641 |
| 1982 | US$ −136.090.000 | US$ −53.569.193 |
| 1981 | US$ 28.220.000 | US$ 13.207.259 |
| 1980 | US$ 80.910.000 | US$ 348.669.038 |
| 1979 | US$ 164.350.000 | US$ 25.692.486 |
| 1978 | US$ 909.060.000 | US$ 135.152.172 |
| 1977 | US$ 345.690.000 | US$ 178.452.647 |
| 1976 | US$ −101.590.000 | US$ 187.000.000 |
| 1975 | US$ 494.400.000 | US$ 119.000.000 |
| 1974 | US$ 323.500.000 | US$ 358.000.000 |
| 1973 | US$ 561.500.000 | US$ 51.000.000 |
| 1972 | US$ 91.200.000 | US$ 41.490.000 |
| 1971 | US$ 65.200.000 | US$ 600.000 |
| 1970 | US$ 28.000.000 | US$ 80.120.000 |
Em 2025, as entradas líquidas de investimento estrangeiro direto foram de US$ 1,65 bilhão no Irã e de US$ 1,54 bilhão na Argélia: 6,8% a mais no Irã. Em 1970, foram de US$ 28 milhões no Irã e de US$ 80,1 milhões na Argélia.
As entradas líquidas de investimento estrangeiro direto no Irã foram maiores que na Argélia em 37 dos 56 anos de 1970 a 2025, e menores em 19. As entradas líquidas no Irã e na Argélia foram negativas (desinvestimento) ao mesmo tempo em apenas um desses anos, 1982.
Irã vs Argélia: entradas e saídas mais recentes de investimento estrangeiro
|
Irã
|
Argélia
|
|
|---|---|---|
| Entradas líquidas | +US$ 1,65 bi | +US$ 1,54 bi |
| Entradas líquidas, % do PIB | +0,5% | +0,5% |
| Saídas líquidas | +US$ 104 mi | +US$ 47,6 mi |
| Entradas líquidas, total 2016–2025 | +US$ 21,1 bi | +US$ 12,0 bi |
| Posição mundial | 78/192 | 80/192 |
Comparar o investimento estrangeiro direto de 2 países quaisquer
Fontes:
- Banco Mundial | Financial Sector (1970–2025, atualizado em outubro de 2026)
Creative Commons Atribuição (CC BY): você pode copiar, compartilhar, adaptar e reutilizar este conteúdo, inclusive para fins comerciais, desde que cite o statistics.wiki e indique as alterações que fizer. As fontes listadas acima podem ter suas próprias condições de licença.