
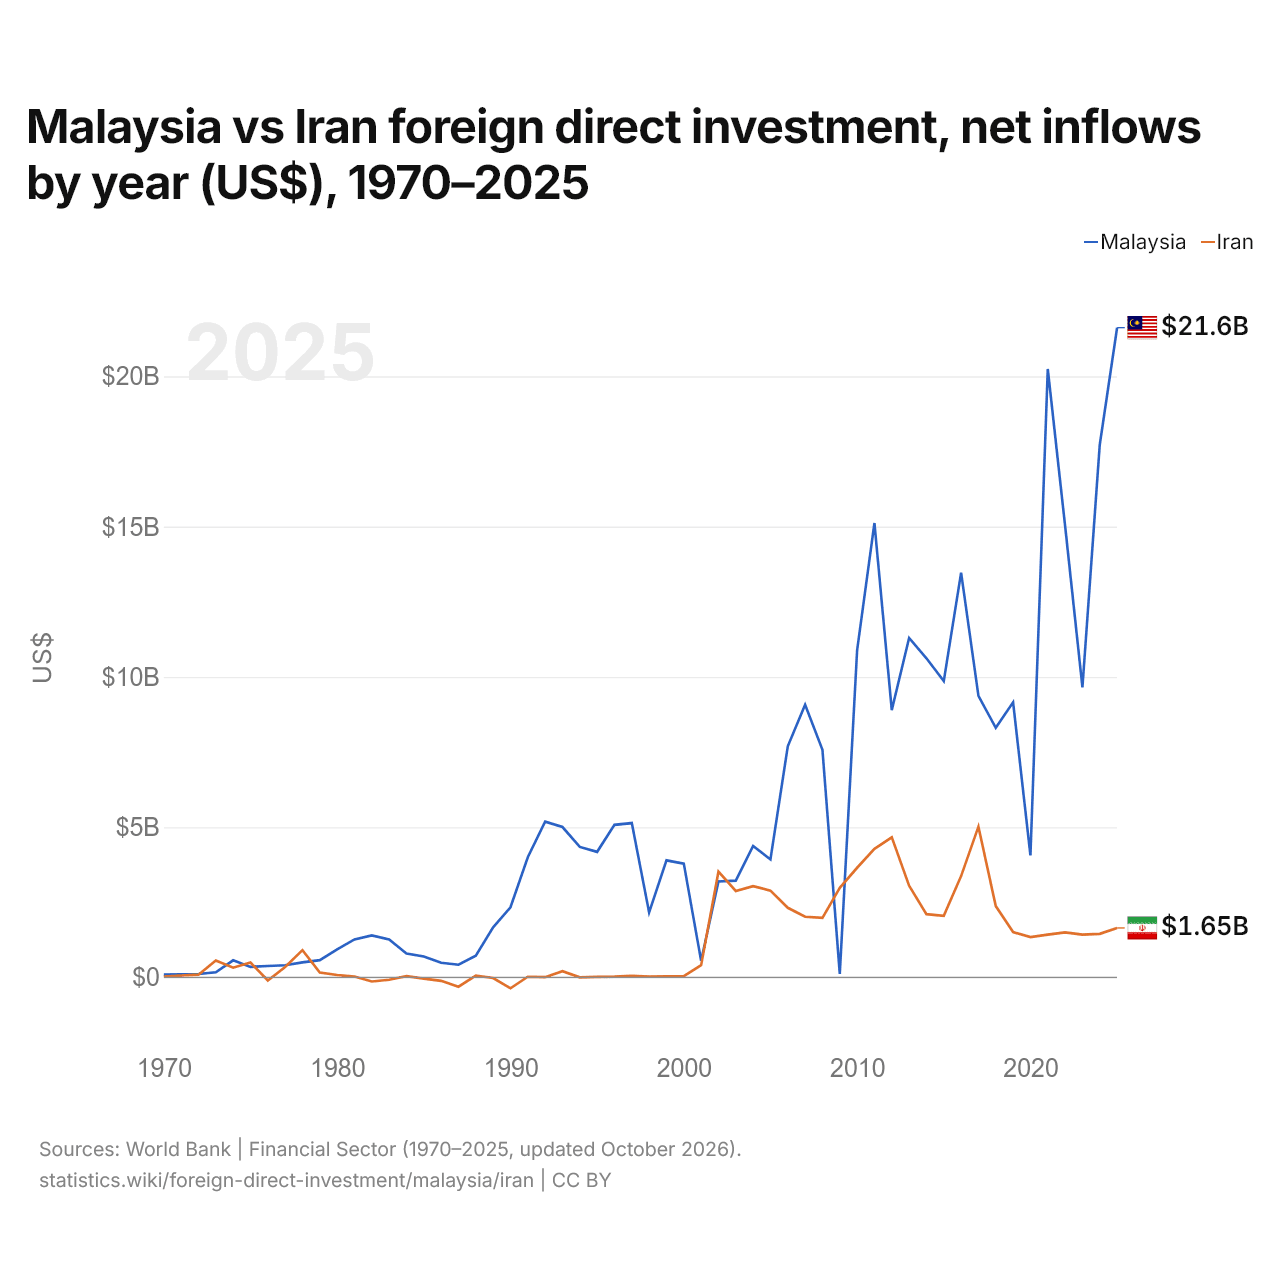
Malásia vs Irã: investimento estrangeiro direto, entradas líquidas por ano (US$), 1970–2025
1x
| Ano | US$ | |
|---|---|---|
 Malásia |
 Irã |
|
| 2025 | US$ 21.618.816.971 | US$ 1.646.577.407 |
| 2024 | US$ 17.724.927.818 | US$ 1.449.111.111 |
| 2023 | US$ 9.652.698.629 | US$ 1.422.333.333 |
| 2022 | US$ 15.027.992.711 | US$ 1.500.000.000 |
| 2021 | US$ 20.245.157.327 | US$ 1.425.000.000 |
| 2020 | US$ 4.058.769.679 | US$ 1.342.000.000 |
| 2019 | US$ 9.154.921.685 | US$ 1.508.000.000 |
| 2018 | US$ 8.304.480.742 | US$ 2.373.000.000 |
| 2017 | US$ 9.368.469.823 | US$ 5.019.000.000 |
| 2016 | US$ 13.470.089.921 | US$ 3.372.000.000 |
| 2015 | US$ 9.857.162.112 | US$ 2.050.000.000 |
| 2014 | US$ 10.619.431.583 | US$ 2.105.494.000 |
| 2013 | US$ 11.296.279.514 | US$ 3.049.945.000 |
| 2012 | US$ 8.895.774.251 | US$ 4.661.734.400 |
| 2011 | US$ 15.119.439.204 | US$ 4.276.718.690 |
| 2010 | US$ 10.885.801.852 | US$ 3.648.972.410 |
| 2009 | US$ 114.664.435 | US$ 2.983.421.910 |
| 2008 | US$ 7.572.512.432 | US$ 1.979.988.010 |
| 2007 | US$ 9.071.369.835 | US$ 2.017.791.750 |
| 2006 | US$ 7.690.731.246 | US$ 2.317.538.500 |
| 2005 | US$ 3.924.786.635 | US$ 2.889.191.670 |
| 2004 | US$ 4.376.052.632 | US$ 3.037.299.840 |
| 2003 | US$ 3.218.947.368 | US$ 2.877.481.500 |
| 2002 | US$ 3.192.894.737 | US$ 3.519.380.360 |
| 2001 | US$ 553.947.368 | US$ 408.118.760 |
| 2000 | US$ 3.787.631.579 | US$ 39.000.000 |
| 1999 | US$ 3.895.263.158 | US$ 35.000.000 |
| 1998 | US$ 2.163.401.816 | US$ 24.000.000 |
| 1997 | US$ 5.136.514.576 | US$ 53.000.000 |
| 1996 | US$ 5.078.414.948 | US$ 26.000.000 |
| 1995 | US$ 4.178.239.335 | US$ 17.000.000 |
| 1994 | US$ 4.341.800.916 | US$ 2.000.000 |
| 1993 | US$ 5.005.642.760 | US$ 207.550.000 |
| 1992 | US$ 5.183.358.086 | US$ 8.500.000 |
| 1991 | US$ 3.998.448.522 | US$ 22.590.000 |
| 1990 | US$ 2.332.455.289 | US$ −361.950.000 |
| 1989 | US$ 1.667.871.569 | US$ −19.420.000 |
| 1988 | US$ 719.418.050 | US$ 60.540.000 |
| 1987 | US$ 422.679.710 | US$ −307.630.000 |
| 1986 | US$ 488.874.111 | US$ −112.440.000 |
| 1985 | US$ 694.712.466 | US$ −38.150.000 |
| 1984 | US$ 797.476.861 | US$ 42.690.000 |
| 1983 | US$ 1.260.527.733 | US$ −78.520.000 |
| 1982 | US$ 1.397.196.045 | US$ −136.090.000 |
| 1981 | US$ 1.264.688.331 | US$ 28.220.000 |
| 1980 | US$ 933.903.976 | US$ 80.910.000 |
| 1979 | US$ 573.467.422 | US$ 164.350.000 |
| 1978 | US$ 499.991.005 | US$ 909.060.000 |
| 1977 | US$ 405.885.819 | US$ 345.690.000 |
| 1976 | US$ 381.259.652 | US$ −101.590.000 |
| 1975 | US$ 350.491.203 | US$ 494.400.000 |
| 1974 | US$ 570.819.255 | US$ 323.500.000 |
| 1973 | US$ 172.000.000 | US$ 561.500.000 |
| 1972 | US$ 114.000.000 | US$ 91.200.000 |
| 1971 | US$ 100.000.000 | US$ 65.200.000 |
| 1970 | US$ 94.000.000 | US$ 28.000.000 |
Em 2025, as entradas líquidas de investimento estrangeiro direto foram de US$ 21,6 bilhões na Malásia e de US$ 1,65 bilhão no Irã: 13 vezes mais na Malásia. Em 1970, foram de US$ 94 milhões na Malásia e de US$ 28 milhões no Irã.
As entradas líquidas de investimento estrangeiro direto na Malásia foram maiores que no Irã em 51 dos 56 anos de 1970 a 2025, e menores em 5.
Malásia vs Irã: entradas e saídas mais recentes de investimento estrangeiro
|
Malásia
|
Irã
|
|
|---|---|---|
| Entradas líquidas | +US$ 21,6 bi | +US$ 1,65 bi |
| Entradas líquidas, % do PIB | +4,6% | +0,5% |
| Saídas líquidas | +US$ 9,09 bi | +US$ 104 mi |
| Entradas líquidas, total 2016–2025 | +US$ 129 bi | +US$ 21,1 bi |
| Posição mundial | 21/192 | 78/192 |
Comparar o investimento estrangeiro direto de 2 países quaisquer
Fontes:
- Banco Mundial | Financial Sector (1970–2025, atualizado em outubro de 2026)
Creative Commons Atribuição (CC BY): você pode copiar, compartilhar, adaptar e reutilizar este conteúdo, inclusive para fins comerciais, desde que cite o statistics.wiki e indique as alterações que fizer. As fontes listadas acima podem ter suas próprias condições de licença.