
List of countries by population growth rate, with doubling time (2026)
| Rank | Country | Growth rate | Population change | Average yearly growth, 2016–2026 | Doubling time |
|---|---|---|---|---|---|
 World |
+0.84% | +69,420,294 | +0.97% | 72 years | |
| 1 |  Ukraine |
+3.66% | +1,428,075 | −1.21% | – |
| 2 |  Oman |
+3.59% | +196,986 | +2.63% | 27 years |
| 3 |  Syria |
+3.57% | +915,127 | +3.29% | 21 years |
| 4 |  CAR |
+3.4% | +187,436 | +1.92% | 36 years |
| 5 |  Somalia |
+3.33% | +655,269 | +3.54% | 20 years |
| 6 |  Niger |
+3.24% | +905,335 | +3.37% | 21 years |
| 7 |  DR Congo |
+3.24% | +3,650,296 | +3.33% | 21 years |
| 8 |  Sudan |
+3.2% | +1,651,575 | +2.6% | 27 years |
| 9 |  Angola |
+3.02% | +1,179,957 | +3.26% | 22 years |
| 10 |  Mali |
+2.93% | +738,621 | +3.06% | 23 years |
| 11 |  Yemen |
+2.89% | +1,206,802 | +2.96% | 24 years |
| 12 |  Tanzania |
+2.89% | +2,036,496 | +3.04% | 23 years |
| 13 |  Mozambique |
+2.83% | +1,009,737 | +2.97% | 24 years |
| 14 |  Zambia |
+2.79% | +611,434 | +2.91% | 24 years |
| 15 |  Mauritania |
+2.78% | +147,610 | +2.94% | 24 years |
| 16 |  Afghanistan |
+2.75% | +1,203,866 | +2.64% | 27 years |
| 17 |  Uganda |
+2.71% | +1,392,212 | +3.12% | 23 years |
| 18 |  Chad |
+2.66% | +559,150 | +3.62% | 20 years |
| 19 |  Cameroon |
+2.57% | +768,540 | +2.71% | 26 years |
| 20 |  Malawi |
+2.57% | +570,593 | +2.64% | 27 years |
| 21 |  Ethiopia |
+2.55% | +3,458,673 | +2.67% | 26 years |
| 22 |  Ivory Coast |
+2.42% | +791,203 | +2.57% | 27 years |
| 23 |  Benin |
+2.42% | +358,105 | +2.63% | 27 years |
| 24 |  Madagascar |
+2.41% | +787,674 | +2.54% | 28 years |
| 25 |  Equatorial Guinea |
+2.4% | +46,585 | +2.79% | 25 years |
| 26 |  Burundi |
+2.38% | +342,695 | +2.74% | 26 years |
| 27 |  Congo |
+2.38% | +154,095 | +2.43% | 29 years |
| 28 |  Solomon Islands |
+2.36% | +19,808 | +2.63% | 27 years |
| 29 |  UAE |
+2.33% | +268,701 | +2.8% | 25 years |
| 30 |  Senegal |
+2.31% | +437,131 | +2.57% | 27 years |
| 31 |  Guinea |
+2.3% | +347,343 | +2.5% | 28 years |
| 32 |  Rwanda |
+2.26% | +328,777 | +2.26% | 31 years |
| 33 |  Vanuatu |
+2.23% | +7,480 | +2.33% | 30 years |
| 34 |  Gambia |
+2.22% | +62,735 | +2.36% | 30 years |
| 35 |  Burkina Faso |
+2.21% | +531,674 | +2.44% | 29 years |
| 36 |  Guinea-Bissau |
+2.17% | +48,924 | +2.29% | 31 years |
| 37 |  Togo |
+2.15% | +184,959 | +2% | 35 years |
| 38 |  Iraq |
+2.13% | +999,811 | +2.24% | 31 years |
| 39 |  Gabon |
+2.11% | +54,748 | +2.34% | 30 years |
| 40 |  Eritrea |
+2.11% | +75,945 | +1.66% | 42 years |
| 41 |  Bahrain |
+2.1% | +33,533 | +1.39% | 50 years |
| 42 |  Liberia |
+2.08% | +119,153 | +2.09% | 33 years |
| 43 |  Nigeria |
+2.08% | +4,930,583 | +2.18% | 32 years |
| 44 |  Qatar |
+2.04% | +60,698 | +2.04% | 34 years |
| 45 |  Sierra Leone |
+2.03% | +179,108 | +2.25% | 31 years |
| 46 |  South Sudan |
+2.02% | +246,107 | +1.39% | 50 years |
| 47 |  Namibia |
+2.01% | +62,030 | +2.61% | 27 years |
| 48 |  Sao Tome |
+1.99% | +4,779 | +1.87% | 38 years |
| 49 |  Kenya |
+1.93% | +1,112,854 | +1.99% | 35 years |
| 50 |  Zimbabwe |
+1.91% | +323,933 | +1.7% | 41 years |
| 51 |  Uzbekistan |
+1.85% | +686,631 | +1.89% | 37 years |
| 52 |  Comoros |
+1.85% | +16,346 | +1.94% | 36 years |
| 53 |  Ghana |
+1.83% | +641,622 | +1.98% | 35 years |
| 54 |  Cayman Islands |
+1.82% | +1,381 | +2.04% | 34 years |
| 55 |  Tajikistan |
+1.81% | +194,914 | +2.16% | 32 years |
| 56 |  Palestine |
+1.77% | +96,074 | +2.35% | 30 years |
| 57 |  Saudi Arabia |
+1.76% | +651,879 | +1.97% | 36 years |
| 58 |  Seychelles |
+1.75% | +2,141 | +2.81% | 25 years |
| 59 |  Papua New Guinea |
+1.74% | +187,366 | +2.02% | 35 years |
| 60 |  Kuwait |
+1.65% | +80,434 | +2.13% | 33 years |
| 61 |  Honduras |
+1.65% | +181,147 | +1.74% | 40 years |
| 62 |  Botswana |
+1.6% | +41,119 | +1.54% | 45 years |
| 63 |  Turkmenistan |
+1.6% | +122,077 | +1.98% | 35 years |
| 64 |  Pakistan |
+1.59% | +4,065,761 | +1.65% | 42 years |
| 65 |  Guatemala |
+1.51% | +282,835 | +1.55% | 45 years |
| 66 |  Kyrgyzstan |
+1.48% | +108,725 | +1.9% | 37 years |
| 67 |  Egypt |
+1.48% | +1,748,598 | +1.68% | 42 years |
| 68 |  Kiribati |
+1.45% | +1,973 | +1.57% | 44 years |
| 69 |  Israel |
+1.37% | +139,127 | +1.85% | 38 years |
| 70 |  Belize |
+1.37% | +5,795 | +1.63% | 43 years |
| 71 |  Bolivia |
+1.34% | +169,203 | +1.32% | 53 years |
| 72 |  Laos |
+1.31% | +102,830 | +1.45% | 48 years |
| 73 |  Nicaragua |
+1.3% | +91,175 | +1.31% | 53 years |
| 74 |  Algeria |
+1.29% | +611,499 | +1.64% | 43 years |
| 75 |  Djibouti |
+1.28% | +15,104 | +1.46% | 48 years |
| 76 |  East Timor |
+1.27% | +18,047 | +1.58% | 44 years |
| 77 |  Bangladesh |
+1.23% | +2,152,383 | +1.01% | 69 years |
| 78 |  Panama |
+1.21% | +55,379 | +1.39% | 50 years |
| 79 |  Paraguay |
+1.19% | +83,569 | +1.28% | 55 years |
| 80 |  Kazakhstan |
+1.19% | +247,096 | +1.39% | 50 years |
| 81 |  Cambodia |
+1.17% | +208,133 | +1.31% | 53 years |
| 82 |  Mongolia |
+1.16% | +41,417 | +1.57% | 44 years |
| 83 |  Malaysia |
+1.16% | +415,855 | +1.36% | 51 years |
| 84 |  South Africa |
+1.12% | +725,705 | +1.35% | 52 years |
| 85 |  Iceland |
+1.12% | +4,389 | +1.69% | 41 years |
| 86 |  Haiti |
+1.12% | +133,092 | +1.21% | 57 years |
| 87 |  Lesotho |
+1.1% | +25,997 | +1.15% | 60 years |
| 88 |  Eswatini |
+1.09% | +13,748 | +1% | 70 years |
| 89 |  Andorra |
+1.09% | +899 | +1.5% | 46 years |
| 90 |  Luxembourg |
+1.06% | +7,278 | +1.78% | 39 years |
| 91 |  Libya |
+1.05% | +78,508 | +1.29% | 54 years |
| 92 |  Peru |
+1.02% | +353,518 | +1.24% | 56 years |
| 93 |  Colombia |
+0.99% | +527,813 | +1.3% | 54 years |
| 94 |  Ireland |
+0.96% | +52,800 | +1.52% | 46 years |
| 95 |  Australia |
+0.96% | +265,522 | +1.43% | 49 years |
| 96 |  Malta |
+0.95% | +5,521 | +2.56% | 27 years |
| 97 |  Canada |
+0.9% | +376,091 | +1.53% | 46 years |
| 98 |  Morocco |
+0.89% | +340,921 | +1.02% | 68 years |
| 99 |  Cyprus |
+0.88% | +12,107 | +1.12% | 62 years |
| 100 |  India |
+0.88% | +12,917,112 | +0.95% | 74 years |
| 101 |  Iran |
+0.86% | +797,391 | +1.07% | 65 years |
| 102 |  Suriname |
+0.86% | +5,487 | +0.94% | 74 years |
| 103 |  Ecuador |
+0.85% | +154,848 | +1.12% | 62 years |
| 104 |  Mexico |
+0.81% | +1,070,898 | +0.85% | 82 years |
| 105 |  Philippines |
+0.81% | +945,150 | +0.99% | 71 years |
| 106 |  Lebanon |
+0.8% | +46,763 | −0.7% | – |
| 107 |  Dominican Republic |
+0.79% | +91,080 | +0.96% | 72 years |
| 108 |  Indonesia |
+0.77% | +2,206,524 | +0.85% | 82 years |
| 109 |  Brunei |
+0.76% | +3,526 | +0.95% | 73 years |
| 110 |  New Zealand |
+0.7% | +37,290 | +1.3% | 54 years |
| 111 |  Norway |
+0.7% | +39,111 | +0.77% | 91 years |
| 112 |  Bhutan |
+0.69% | +5,495 | +0.7% | 99 years |
| 113 |  Singapore |
+0.63% | +38,505 | +0.93% | 75 years |
| 114 |  Nauru |
+0.63% | +75 | +0.82% | 85 years |
| 115 |  Myanmar |
+0.63% | +342,962 | +0.7% | 100 years |
| 116 |  Liechtenstein |
+0.62% | +254 | +0.91% | 77 years |
| 117 |  Netherlands |
+0.6% | +108,553 | +0.66% | 105 years |
| 118 |  Vatican |
+0.6% | +6 | n/a | – |
| 119 |  Vietnam |
+0.59% | +598,650 | +0.84% | 83 years |
| 120 |  Guyana |
+0.59% | +4,904 | +0.97% | 72 years |
| 121 |  United Kingdom |
+0.57% | +396,746 | +0.63% | 110 years |
| 122 |  Azerbaijan |
+0.57% | +58,006 | +0.55% | 127 years |
| 123 |  Tunisia |
+0.56% | +69,424 | +0.75% | 93 years |
| 124 |  Samoa |
+0.56% | +1,222 | +0.81% | 86 years |
| 125 |  Sri Lanka |
+0.52% | +114,145 | +0.31% | 226 years |
| 126 |  United States |
+0.52% | +1,780,569 | +0.58% | 120 years |
| 127 |  Switzerland |
+0.48% | +43,733 | +0.88% | 79 years |
| 128 |  Fiji |
+0.46% | +4,270 | +0.2% | 352 years |
| 129 |  Antigua |
+0.46% | +429 | +0.51% | 137 years |
| 130 |  Chile |
+0.45% | +89,820 | +0.88% | 79 years |
| 131 |  Cape Verde |
+0.45% | +2,376 | +0.33% | 211 years |
| 132 |  Sweden |
+0.45% | +47,264 | +0.7% | 99 years |
| 133 |  Costa Rica |
+0.44% | +22,458 | +0.62% | 113 years |
| 134 |  Bahamas |
+0.41% | +1,668 | +0.42% | 165 years |
| 135 |  El Salvador |
+0.41% | +26,258 | +0.3% | 229 years |
| 136 |  Venezuela |
+0.4% | +113,696 | −0.72% | – |
| 137 |  Denmark |
+0.39% | +23,242 | +0.52% | 134 years |
| 138 |  Brazil |
+0.37% | +780,861 | +0.5% | 139 years |
| 139 |  Maldives |
+0.35% | +1,847 | +1.83% | 38 years |
| 140 |  Argentina |
+0.34% | +153,932 | +0.47% | 148 years |
| 141 |  North Korea |
+0.25% | +67,494 | +0.36% | 193 years |
| 142 |  Turkey |
+0.25% | +214,737 | +0.83% | 84 years |
| 143 |  Saint Lucia |
+0.21% | +370 | +0.27% | 253 years |
| 144 |  Trinidad |
+0.18% | +2,440 | +0.12% | 579 years |
| 145 |  Saint Kitts |
+0.16% | +77 | −0.02% | – |
| 146 |  France |
+0.15% | +102,981 | +0.31% | 224 years |
| 147 |  Belgium |
+0.15% | +17,802 | +0.54% | 128 years |
| 148 |  San Marino |
+0.1% | +35 | +0.31% | 223 years |
| 149 |  Grenada |
+0.07% | +87 | +0.19% | 357 years |
| 150 |  Barbados |
+0.05% | +129 | +0.11% | 618 years |
| 151 |  Finland |
+0.03% | +1,511 | +0.27% | 253 years |
| 152 |  Curacao |
−0.02% | −27 | −0.22% | – |
| 153 |  Georgia |
−0.04% | −1,716 | +0.54% | 129 years |
| 154 |  Uruguay |
−0.06% | −2,016 | +0.01% | – |
| 155 |  Spain |
−0.06% | −31,485 | +0.6% | 116 years |
| 156 |  Nepal |
−0.07% | −20,077 | +0.57% | 121 years |
| 157 |  Austria |
−0.07% | −6,661 | +0.52% | 134 years |
| 158 |  Thailand |
−0.08% | −53,882 | +0.1% | 699 years |
| 159 |  Jamaica |
−0.1% | −2,900 | +0.09% | 806 years |
| 160 |  Slovenia |
−0.1% | −2,208 | +0.3% | 228 years |
| 161 |  South Korea |
−0.12% | −60,115 | +0.08% | 876 years |
| 162 |  Portugal |
−0.16% | −16,800 | +0.44% | 158 years |
| 163 |  China |
−0.23% | −3,249,330 | +0.11% | 622 years |
| 164 |  Mauritius |
−0.24% | −3,020 | −0.18% | – |
| 165 |  Palau |
−0.24% | −43 | −0.1% | – |
| 166 |  Italy |
−0.35% | −207,487 | −0.24% | – |
| 167 |  Cuba |
−0.4% | −43,453 | −0.34% | – |
| 168 |  Greece |
−0.41% | −42,387 | −0.38% | – |
| 169 |  Tonga |
−0.44% | −459 | −0.21% | – |
| 170 |  North Macedonia |
−0.52% | −9,443 | −0.51% | – |
| 171 |  Taiwan |
−0.52% | −121,268 | −0.12% | – |
| 172 |  Japan |
−0.54% | −662,482 | −0.35% | – |
| 173 |  Dominica |
−0.56% | −370 | −0.61% | – |
| 174 |  Romania |
−0.57% | −107,704 | −0.41% | – |
| 175 |  Russia |
−0.61% | −870,155 | −0.16% | – |
| 176 |  Hungary |
−0.63% | −59,592 | −0.32% | – |
| 177 |  Belarus |
−0.66% | −60,170 | −0.48% | – |
| 178 |  Bulgaria |
−0.67% | −43,153 | −0.76% | – |
| 179 |  Saint Vincent |
−0.68% | −681 | −0.69% | – |
| 180 |  Croatia |
−0.68% | −26,412 | −0.64% | – |
| 181 |  Slovakia |
−0.69% | −37,574 | −0.1% | – |
| 182 |  Armenia |
−0.73% | −22,664 | +0.24% | 293 years |
| 183 |  Albania |
−0.74% | −17,502 | −1.42% | – |
| 184 |  Serbia |
−0.75% | −48,887 | −0.82% | – |
| 185 |  Monaco |
−0.75% | −287 | +0.21% | 336 years |
| 186 |  Germany |
−0.79% | −660,435 | +0.06% | – |
| 187 |  Bosnia |
−0.81% | −25,359 | −1.08% | – |
| 188 |  Jordan |
−0.94% | −107,743 | +1.32% | 53 years |
| 189 |  Latvia |
−1.13% | −20,799 | −0.7% | – |
| 190 |  Poland |
−1.18% | −428,787 | −0.53% | – |
| 191 |  Czech Republic |
−1.33% | −144,595 | +0.17% | 420 years |
| 192 |  Moldova |
−1.35% | −31,927 | −1.84% | – |
| 193 |  Estonia |
−1.42% | −19,448 | +0.23% | 295 years |
| 194 |  Lithuania |
−1.49% | −43,081 | −0.11% | – |
| 195 |  Montenegro |
−1.5% | −9,370 | −0.19% | – |
| 196 |  Tuvalu |
−1.51% | −143 | −1.55% | – |
| 197 |  Marshall Islands |
−3.42% | −1,243 | −3.04% | – |
In 2026, the population grows fastest in Ukraine, by 3.7% a year, and falls fastest in the Marshall Islands, by 3.4%. It grows in 151 of the 197 countries and falls in 46. The world population grows by 0.8%, or 69.4 million people. The largest increase is in India, 12.9 million people, and the largest decrease in China, 3.25 million people.
The population growth rate is the change in a country's population over a year as a share of its population at the start: births minus deaths, plus the people who move in minus those who leave. The figures up to 2025 are the World Bank's; the later years are the growth of the United Nations' projections (World Population Prospects).
Population growth by country map, 1961–2026
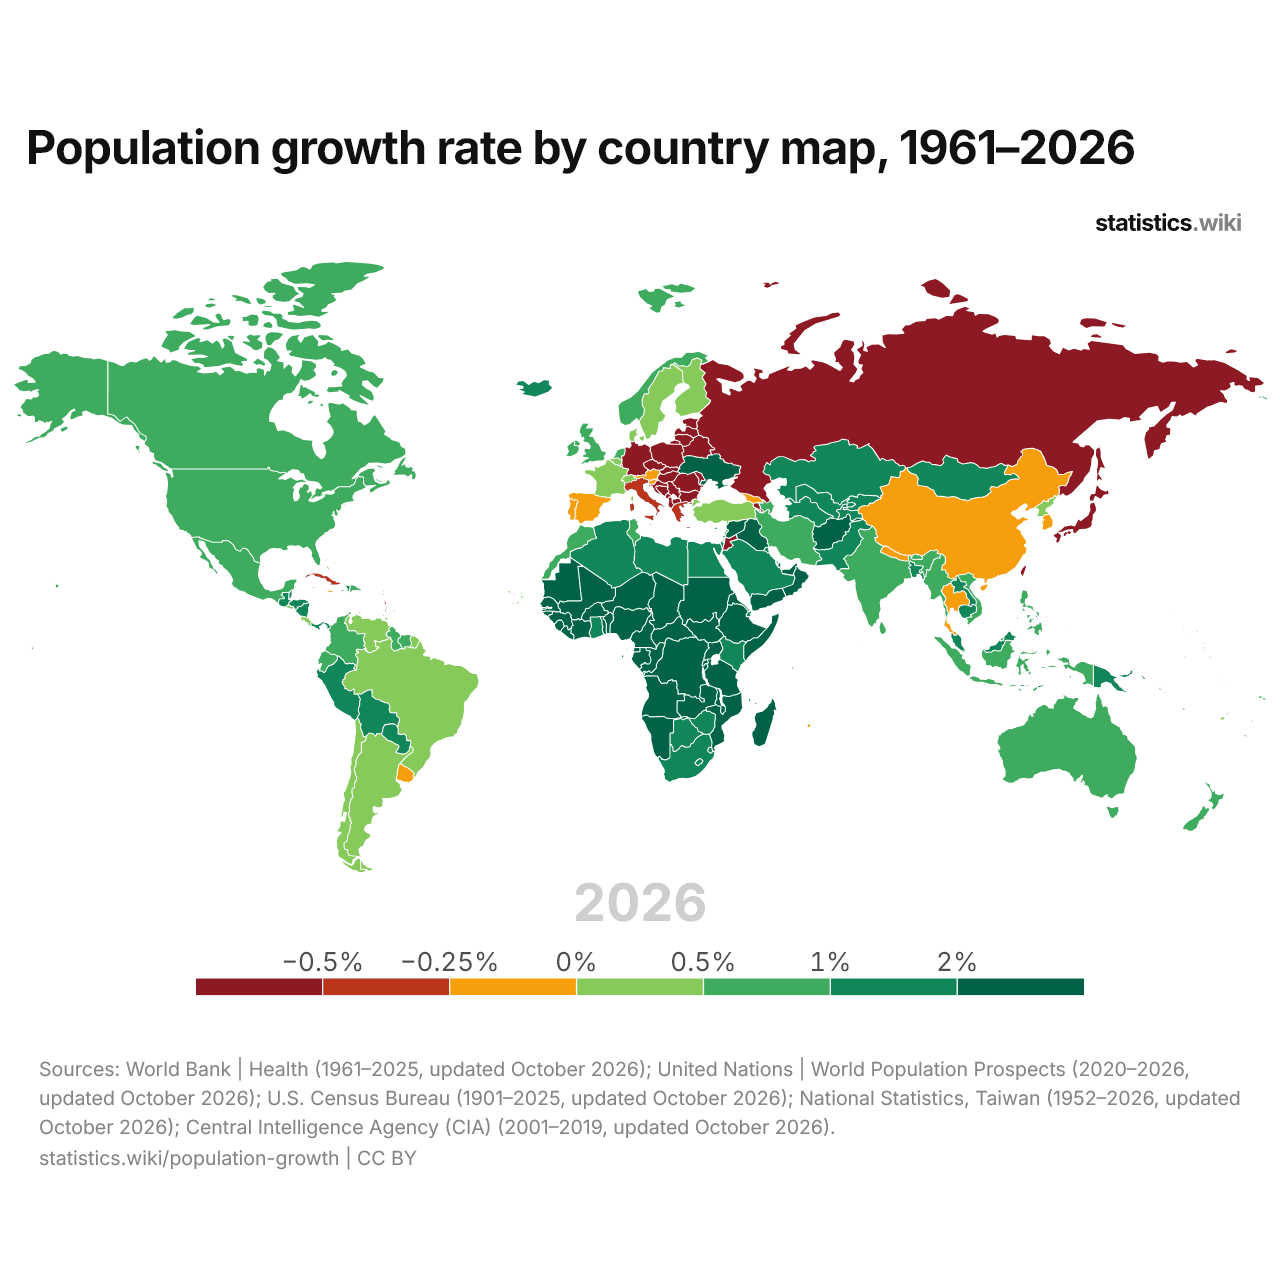
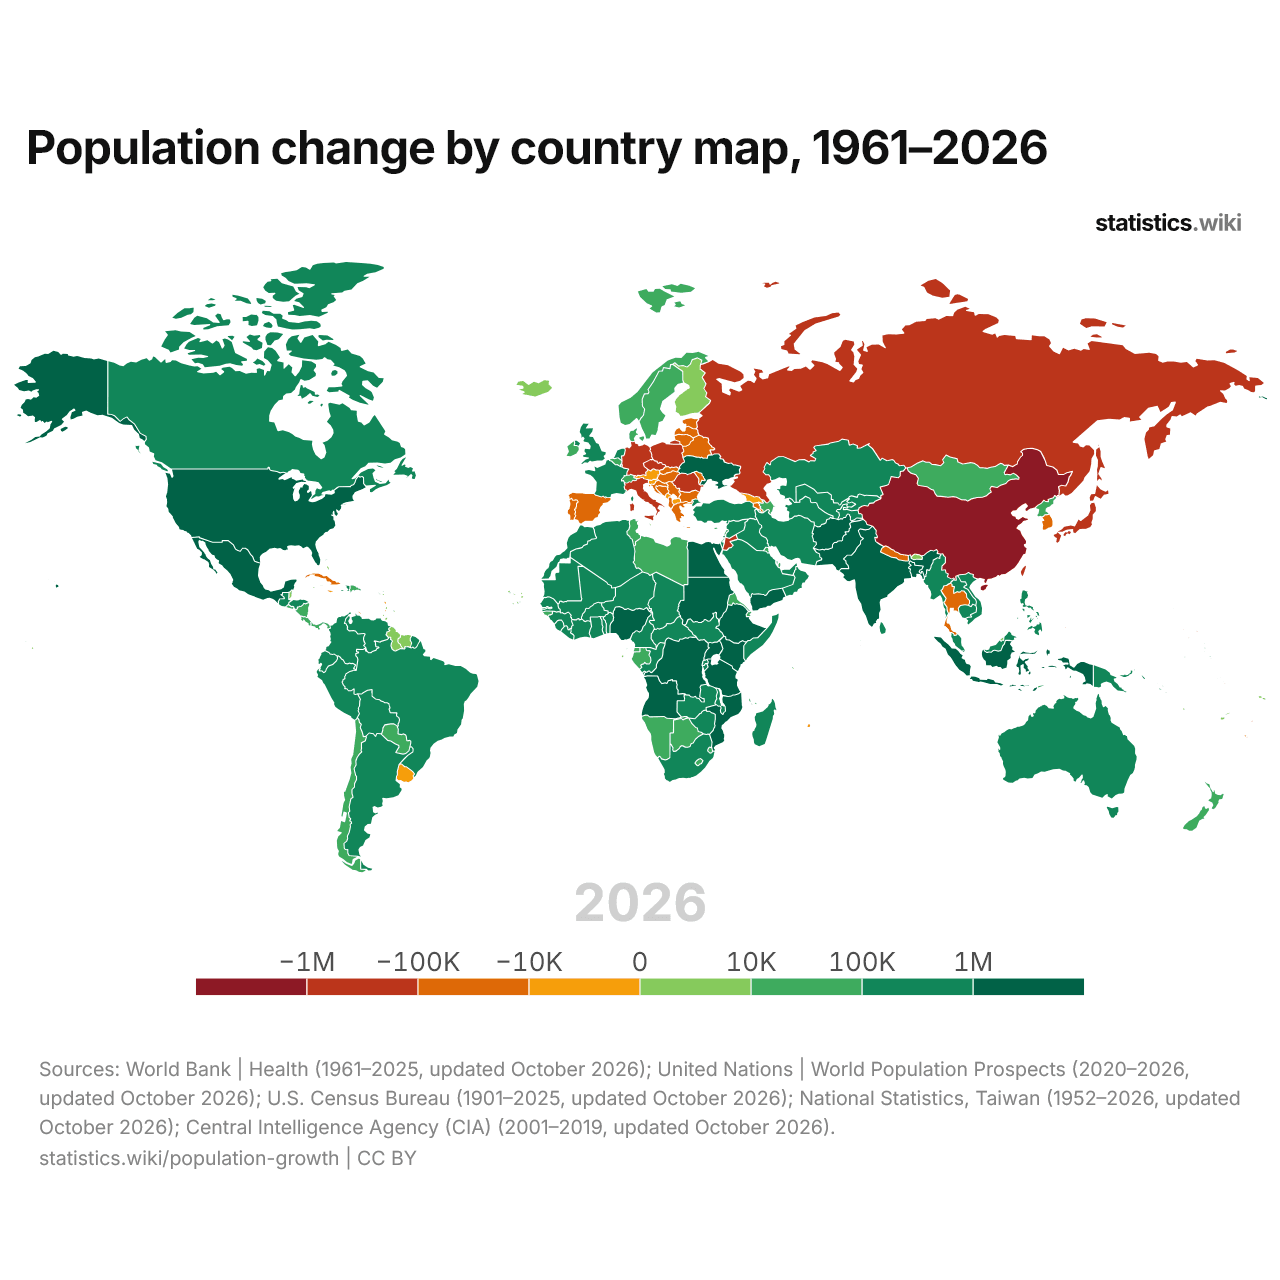
In 2026, the population falls in 46 countries and grows by more than 2% a year in 47. In 1961, it fell in 5 and grew by more than 2% in 119. In 2026, 19 countries add more than 1 million people a year, compared with 8 in 1961.
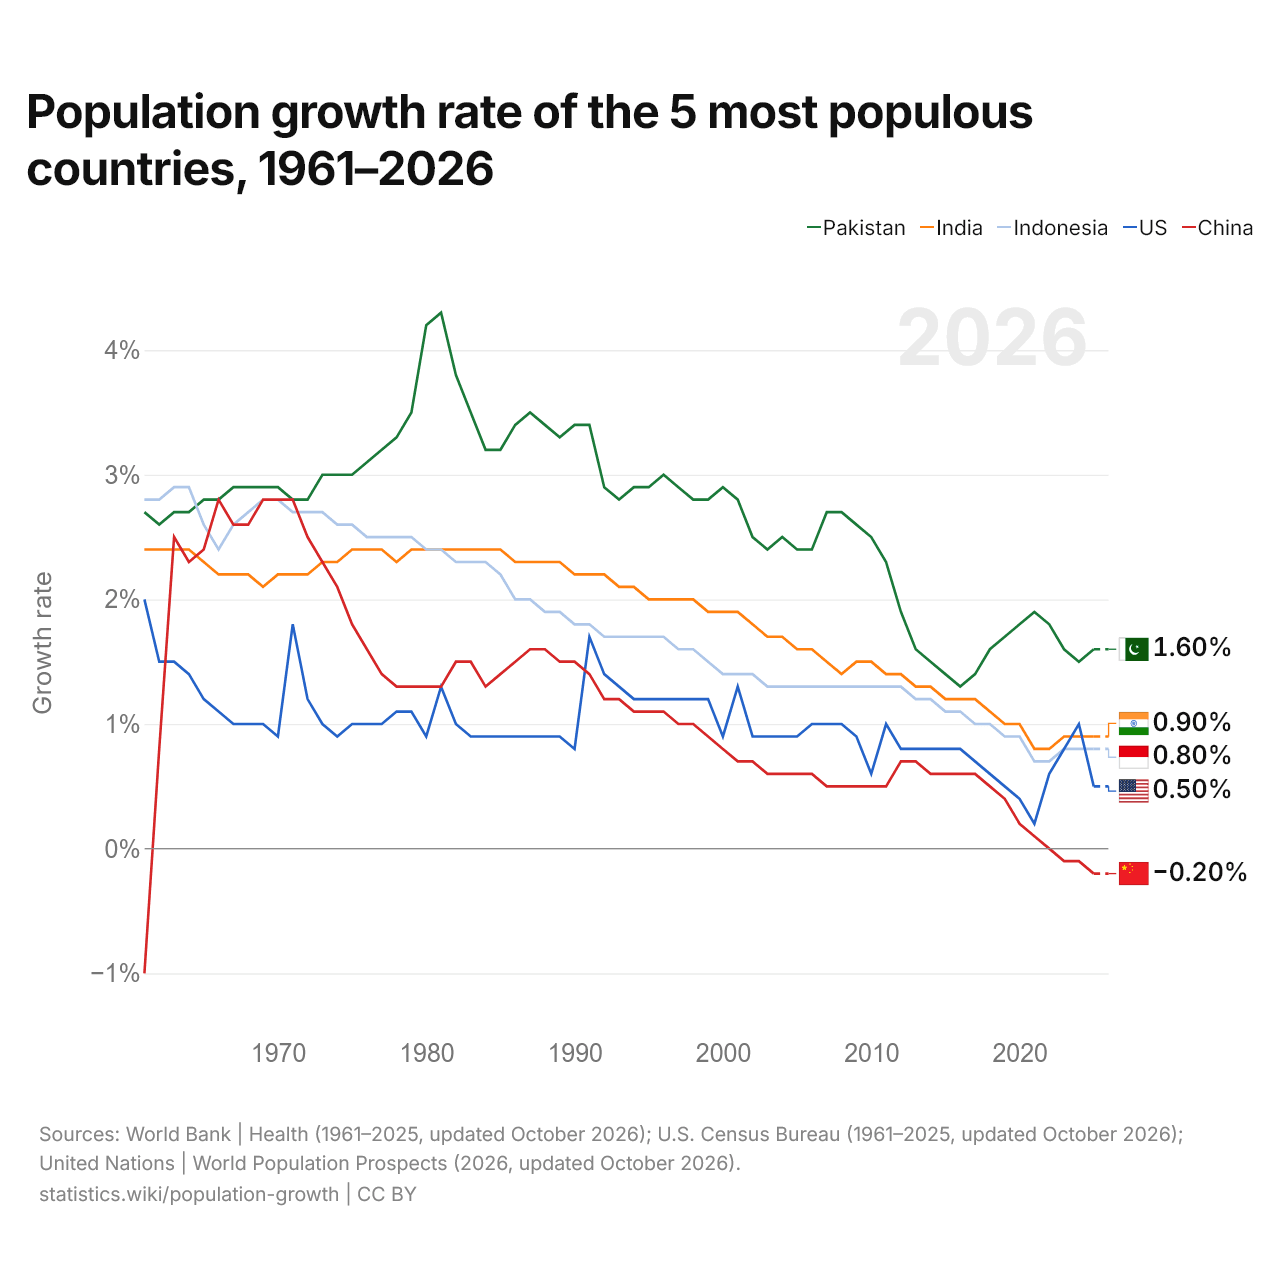
Population growth rate of the 5 most populous countries, 1961–2026
| Year | Growth rate | ||||
|---|---|---|---|---|---|
| Pakistan | India | Indonesia | United States | China | |
| 2026 projected | 1.6% | 0.9% | 0.8% | 0.5% | −0.2% |
| 2025 | 1.6% | 0.9% | 0.8% | 0.5% | −0.2% |
| 2024 | 1.5% | 0.9% | 0.8% | 1% | −0.1% |
| 2023 | 1.6% | 0.9% | 0.8% | 0.8% | −0.1% |
| 2022 | 1.8% | 0.8% | 0.7% | 0.6% | 0% |
| 2021 | 1.9% | 0.8% | 0.7% | 0.2% | 0.1% |
| 2020 | 1.8% | 1% | 0.9% | 0.4% | 0.2% |
| 2019 | 1.7% | 1% | 0.9% | 0.5% | 0.4% |
| 2018 | 1.6% | 1.1% | 1% | 0.6% | 0.5% |
| 2017 | 1.4% | 1.2% | 1% | 0.7% | 0.6% |
| 2016 | 1.3% | 1.2% | 1.1% | 0.8% | 0.6% |
| 2015 | 1.4% | 1.2% | 1.1% | 0.8% | 0.6% |
| 2014 | 1.5% | 1.3% | 1.2% | 0.8% | 0.6% |
| 2013 | 1.6% | 1.3% | 1.2% | 0.8% | 0.7% |
| 2012 | 1.9% | 1.4% | 1.3% | 0.8% | 0.7% |
| 2011 | 2.3% | 1.4% | 1.3% | 1% | 0.5% |
| 2010 | 2.5% | 1.5% | 1.3% | 0.6% | 0.5% |
| 2009 | 2.6% | 1.5% | 1.3% | 0.9% | 0.5% |
| 2008 | 2.7% | 1.4% | 1.3% | 1% | 0.5% |
| 2007 | 2.7% | 1.5% | 1.3% | 1% | 0.5% |
| 2006 | 2.4% | 1.6% | 1.3% | 1% | 0.6% |
| 2005 | 2.4% | 1.6% | 1.3% | 0.9% | 0.6% |
| 2004 | 2.5% | 1.7% | 1.3% | 0.9% | 0.6% |
| 2003 | 2.4% | 1.7% | 1.3% | 0.9% | 0.6% |
| 2002 | 2.5% | 1.8% | 1.4% | 0.9% | 0.7% |
| 2001 | 2.8% | 1.9% | 1.4% | 1.3% | 0.7% |
| 2000 | 2.9% | 1.9% | 1.4% | 0.9% | 0.8% |
| 1999 | 2.8% | 1.9% | 1.5% | 1.2% | 0.9% |
| 1998 | 2.8% | 2% | 1.6% | 1.2% | 1% |
| 1997 | 2.9% | 2% | 1.6% | 1.2% | 1% |
| 1996 | 3% | 2% | 1.7% | 1.2% | 1.1% |
| 1995 | 2.9% | 2% | 1.7% | 1.2% | 1.1% |
| 1994 | 2.9% | 2.1% | 1.7% | 1.2% | 1.1% |
| 1993 | 2.8% | 2.1% | 1.7% | 1.3% | 1.2% |
| 1992 | 2.9% | 2.2% | 1.7% | 1.4% | 1.2% |
| 1991 | 3.4% | 2.2% | 1.8% | 1.7% | 1.4% |
| 1990 | 3.4% | 2.2% | 1.8% | 0.8% | 1.5% |
| 1989 | 3.3% | 2.3% | 1.9% | 0.9% | 1.5% |
| 1988 | 3.4% | 2.3% | 1.9% | 0.9% | 1.6% |
| 1987 | 3.5% | 2.3% | 2% | 0.9% | 1.6% |
| 1986 | 3.4% | 2.3% | 2% | 0.9% | 1.5% |
| 1985 | 3.2% | 2.4% | 2.2% | 0.9% | 1.4% |
| 1984 | 3.2% | 2.4% | 2.3% | 0.9% | 1.3% |
| 1983 | 3.5% | 2.4% | 2.3% | 0.9% | 1.5% |
| 1982 | 3.8% | 2.4% | 2.3% | 1% | 1.5% |
| 1981 | 4.3% | 2.4% | 2.4% | 1.3% | 1.3% |
| 1980 | 4.2% | 2.4% | 2.4% | 0.9% | 1.3% |
| 1979 | 3.5% | 2.4% | 2.5% | 1.1% | 1.3% |
| 1978 | 3.3% | 2.3% | 2.5% | 1.1% | 1.3% |
| 1977 | 3.2% | 2.4% | 2.5% | 1% | 1.4% |
| 1976 | 3.1% | 2.4% | 2.5% | 1% | 1.6% |
| 1975 | 3% | 2.4% | 2.6% | 1% | 1.8% |
| 1974 | 3% | 2.3% | 2.6% | 0.9% | 2.1% |
| 1973 | 3% | 2.3% | 2.7% | 1% | 2.3% |
| 1972 | 2.8% | 2.2% | 2.7% | 1.2% | 2.5% |
| 1971 | 2.8% | 2.2% | 2.7% | 1.8% | 2.8% |
| 1970 | 2.9% | 2.2% | 2.8% | 0.9% | 2.8% |
| 1969 | 2.9% | 2.1% | 2.8% | 1% | 2.8% |
| 1968 | 2.9% | 2.2% | 2.7% | 1% | 2.6% |
| 1967 | 2.9% | 2.2% | 2.6% | 1% | 2.6% |
| 1966 | 2.8% | 2.2% | 2.4% | 1.1% | 2.8% |
| 1965 | 2.8% | 2.3% | 2.6% | 1.2% | 2.4% |
| 1964 | 2.7% | 2.4% | 2.9% | 1.4% | 2.3% |
| 1963 | 2.7% | 2.4% | 2.9% | 1.5% | 2.5% |
| 1962 | 2.6% | 2.4% | 2.8% | 1.5% | 0.8% |
| 1961 | 2.7% | 2.4% | 2.8% | 2% | −1% |
In 2026, among the five most populous countries, the population grows fastest in Pakistan, by 1.6% a year, and falls in China, by 0.2%. The gap between the fastest and the slowest growth narrowed from 3.8 percentage points in 1961 to 1.8.
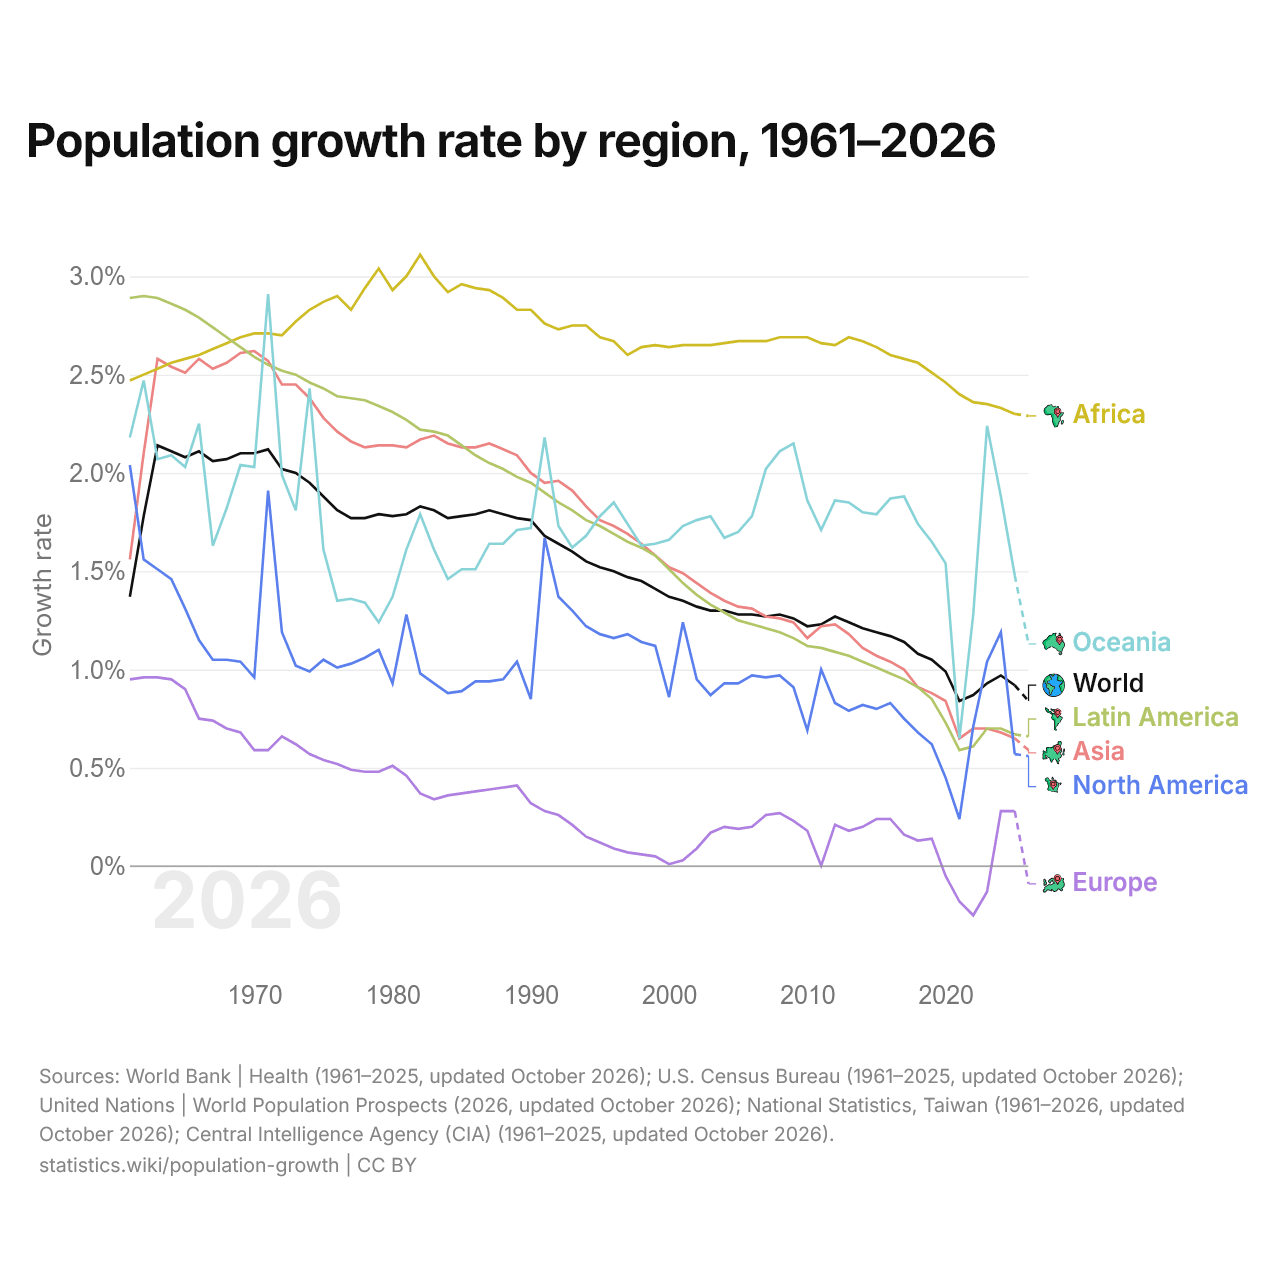
Population growth rate by region, 1961–2026
| Year | Growth rate | ||||||
|---|---|---|---|---|---|---|---|
| World | Asia | Africa | Europe | Latin America | North America | Oceania | |
| 2026 projected | 0.84% | 0.59% | 2.29% | −0.09% | 0.66% | 0.56% | 1.13% |
| 2025 | 0.92% | 0.65% | 2.3% | 0.28% | 0.67% | 0.57% | 1.48% |
| 2024 | 0.97% | 0.68% | 2.33% | 0.28% | 0.7% | 1.19% | 1.88% |
| 2023 | 0.93% | 0.7% | 2.35% | −0.13% | 0.7% | 1.04% | 2.24% |
| 2022 | 0.87% | 0.7% | 2.36% | −0.25% | 0.61% | 0.71% | 1.28% |
| 2021 | 0.84% | 0.65% | 2.4% | −0.18% | 0.59% | 0.24% | 0.65% |
| 2020 | 0.99% | 0.84% | 2.46% | −0.05% | 0.73% | 0.45% | 1.54% |
| 2019 | 1.05% | 0.88% | 2.51% | 0.14% | 0.85% | 0.62% | 1.65% |
| 2018 | 1.08% | 0.91% | 2.56% | 0.13% | 0.91% | 0.68% | 1.74% |
| 2017 | 1.14% | 1% | 2.58% | 0.16% | 0.95% | 0.75% | 1.88% |
| 2016 | 1.17% | 1.04% | 2.6% | 0.24% | 0.98% | 0.83% | 1.87% |
| 2015 | 1.19% | 1.07% | 2.64% | 0.24% | 1.01% | 0.8% | 1.79% |
| 2014 | 1.21% | 1.11% | 2.67% | 0.2% | 1.04% | 0.82% | 1.8% |
| 2013 | 1.24% | 1.18% | 2.69% | 0.18% | 1.07% | 0.79% | 1.85% |
| 2012 | 1.27% | 1.23% | 2.65% | 0.21% | 1.09% | 0.83% | 1.86% |
| 2011 | 1.23% | 1.22% | 2.66% | 0.002% | 1.11% | 1% | 1.71% |
| 2010 | 1.22% | 1.16% | 2.69% | 0.18% | 1.12% | 0.69% | 1.86% |
| 2009 | 1.26% | 1.24% | 2.69% | 0.23% | 1.16% | 0.91% | 2.15% |
| 2008 | 1.28% | 1.26% | 2.69% | 0.27% | 1.19% | 0.97% | 2.11% |
| 2007 | 1.27% | 1.27% | 2.67% | 0.26% | 1.21% | 0.96% | 2.02% |
| 2006 | 1.28% | 1.31% | 2.67% | 0.2% | 1.23% | 0.97% | 1.78% |
| 2005 | 1.28% | 1.32% | 2.67% | 0.19% | 1.25% | 0.93% | 1.7% |
| 2004 | 1.3% | 1.35% | 2.66% | 0.2% | 1.29% | 0.93% | 1.67% |
| 2003 | 1.3% | 1.39% | 2.65% | 0.17% | 1.33% | 0.87% | 1.78% |
| 2002 | 1.32% | 1.44% | 2.65% | 0.09% | 1.38% | 0.95% | 1.76% |
| 2001 | 1.35% | 1.49% | 2.65% | 0.03% | 1.44% | 1.24% | 1.73% |
| 2000 | 1.37% | 1.52% | 2.64% | 0.01% | 1.51% | 0.86% | 1.66% |
| 1999 | 1.41% | 1.58% | 2.65% | 0.05% | 1.58% | 1.12% | 1.64% |
| 1998 | 1.45% | 1.64% | 2.64% | 0.06% | 1.62% | 1.14% | 1.63% |
| 1997 | 1.47% | 1.69% | 2.6% | 0.07% | 1.65% | 1.18% | 1.74% |
| 1996 | 1.5% | 1.73% | 2.67% | 0.09% | 1.69% | 1.16% | 1.85% |
| 1995 | 1.52% | 1.76% | 2.69% | 0.12% | 1.73% | 1.18% | 1.78% |
| 1994 | 1.55% | 1.83% | 2.75% | 0.15% | 1.76% | 1.22% | 1.68% |
| 1993 | 1.6% | 1.91% | 2.75% | 0.21% | 1.81% | 1.3% | 1.62% |
| 1992 | 1.64% | 1.96% | 2.73% | 0.26% | 1.85% | 1.37% | 1.73% |
| 1991 | 1.68% | 1.95% | 2.76% | 0.28% | 1.9% | 1.67% | 2.18% |
| 1990 | 1.76% | 2% | 2.83% | 0.32% | 1.95% | 0.85% | 1.72% |
| 1989 | 1.77% | 2.09% | 2.83% | 0.41% | 1.98% | 1.04% | 1.71% |
| 1988 | 1.79% | 2.12% | 2.89% | 0.4% | 2.02% | 0.95% | 1.64% |
| 1987 | 1.81% | 2.15% | 2.93% | 0.39% | 2.05% | 0.94% | 1.64% |
| 1986 | 1.79% | 2.13% | 2.94% | 0.38% | 2.09% | 0.94% | 1.51% |
| 1985 | 1.78% | 2.13% | 2.96% | 0.37% | 2.14% | 0.89% | 1.51% |
| 1984 | 1.77% | 2.15% | 2.92% | 0.36% | 2.19% | 0.88% | 1.46% |
| 1983 | 1.81% | 2.19% | 3% | 0.34% | 2.21% | 0.93% | 1.61% |
| 1982 | 1.83% | 2.17% | 3.11% | 0.37% | 2.22% | 0.98% | 1.79% |
| 1981 | 1.79% | 2.13% | 3% | 0.46% | 2.27% | 1.28% | 1.61% |
| 1980 | 1.78% | 2.14% | 2.93% | 0.51% | 2.31% | 0.93% | 1.37% |
| 1979 | 1.79% | 2.14% | 3.04% | 0.48% | 2.34% | 1.1% | 1.24% |
| 1978 | 1.77% | 2.13% | 2.94% | 0.48% | 2.37% | 1.06% | 1.34% |
| 1977 | 1.77% | 2.16% | 2.83% | 0.49% | 2.38% | 1.03% | 1.36% |
| 1976 | 1.81% | 2.21% | 2.9% | 0.52% | 2.39% | 1.01% | 1.35% |
| 1975 | 1.88% | 2.28% | 2.87% | 0.54% | 2.43% | 1.05% | 1.61% |
| 1974 | 1.95% | 2.38% | 2.83% | 0.57% | 2.46% | 0.99% | 2.43% |
| 1973 | 2% | 2.45% | 2.77% | 0.62% | 2.5% | 1.02% | 1.81% |
| 1972 | 2.02% | 2.45% | 2.7% | 0.66% | 2.52% | 1.19% | 1.99% |
| 1971 | 2.12% | 2.57% | 2.71% | 0.59% | 2.55% | 1.91% | 2.91% |
| 1970 | 2.1% | 2.62% | 2.71% | 0.59% | 2.59% | 0.96% | 2.03% |
| 1969 | 2.1% | 2.61% | 2.69% | 0.68% | 2.64% | 1.04% | 2.04% |
| 1968 | 2.07% | 2.56% | 2.66% | 0.7% | 2.69% | 1.05% | 1.82% |
| 1967 | 2.06% | 2.53% | 2.63% | 0.74% | 2.74% | 1.05% | 1.63% |
| 1966 | 2.11% | 2.58% | 2.6% | 0.75% | 2.79% | 1.15% | 2.25% |
| 1965 | 2.08% | 2.51% | 2.58% | 0.9% | 2.83% | 1.31% | 2.03% |
| 1964 | 2.11% | 2.54% | 2.56% | 0.95% | 2.86% | 1.46% | 2.09% |
| 1963 | 2.14% | 2.58% | 2.53% | 0.96% | 2.89% | 1.51% | 2.07% |
| 1962 | 1.78% | 2.1% | 2.5% | 0.96% | 2.9% | 1.56% | 2.47% |
| 1961 | 1.37% | 1.56% | 2.47% | 0.95% | 2.89% | 2.04% | 2.18% |
In 2026, the world population grows by 0.8%; growth is fastest in Africa, at 2.3%, and the population falls in Europe, by 0.1%. World growth was highest in 1963, at 2.1%; in 1961 it was 1.4%.
Compare the population growth of any 2 countries
Sources:
- World Bank | Health (1961–2025, updated October 2026)
- United Nations | World Population Prospects (2020–2026, updated October 2026)
- U.S. Census Bureau (1901–2025, updated October 2026)
- National Statistics, Taiwan (1952–2026, updated October 2026)
- Central Intelligence Agency (CIA) (1961–2025, updated October 2026)
Creative Commons Attribution (CC BY): you may copy, share, adapt and reuse this content, also commercially, as long as you credit statistics.wiki and note any changes you made. The sources listed above may have their own license terms.