
Countries with a declining population in 2026
| Rank | Country | Population | Change, % | Change, people | Declining since | Peak population |
|---|---|---|---|---|---|---|
| 1 |
 Marshall Islands |
35,039 | −3.42% | −1,243 | 2011 | 52K (2010) |
| 2 |
 Tuvalu |
9,349 | −1.51% | −143 | 2014 | 11K (2013) |
| 3 |
 Montenegro |
613,759 | −1.5% | −9,370 | 2020 | 627K (2019) |
| 4 |
 Lithuania |
2,845,693 | −1.49% | −43,081 | 2026 | 3.7M (1991) |
| 5 |
 Estonia |
1,347,027 | −1.42% | −19,448 | 2025 | 1.57M (1990) |
| 6 |
 Moldova |
2,328,600 | −1.35% | −31,927 | 1992 | 2.98M (1991) |
| 7 |
 Czech Republic |
10,742,283 | −1.33% | −144,595 | 2025 | 10.9M (2024) |
| 8 |
 Poland |
36,007,074 | −1.18% | −428,787 | 2018 | 38.7M (1998) |
| 9 |
 Latvia |
1,826,986 | −1.13% | −20,799 | 2024 | 2.67M (1989) |
| 10 |
 Jordan |
11,412,941 | −0.94% | −107,743 | 2025 | 11.6M (2024) |
| 11 |
 Bosnia |
3,114,736 | −0.81% | −25,359 | 2003 | 4.46M (1991) |
| 12 |
 Germany |
82,830,814 | −0.79% | −660,435 | 2025 | 83.5M (2024) |
| 13 |
 Monaco |
38,054 | −0.75% | −287 | 2024 | 39K (2023) |
| 14 |
 Serbia |
6,500,256 | −0.75% | −48,887 | 1996 | 7.9M (1990) |
| 15 |
 Albania |
2,332,078 | −0.74% | −17,502 | 1991 | 3.29M (1990) |
| 16 |
 Armenia |
3,064,036 | −0.73% | −22,664 | 2026 | 3.61M (1991) |
| 17 |
 Slovakia |
5,376,239 | −0.69% | −37,574 | 2021 | 5.46M (2020) |
| 18 |
 Croatia |
3,849,788 | −0.68% | −26,412 | 2026 | 4.78M (1990) |
| 19 |
 Saint Vincent |
99,243 | −0.68% | −681 | 2001 | 114K (2000) |
| 20 |
 Bulgaria |
6,390,149 | −0.67% | −43,153 | 1989 | 8.98M (1988) |
| 21 |
 Belarus |
9,025,821 | −0.66% | −60,170 | 2017 | 10.2M (1993) |
| 22 |
 Hungary |
9,454,659 | −0.63% | −59,592 | 1982 | 10.7M (1981) |
| 23 |
 Russia |
142,643,173 | −0.61% | −870,155 | 2020 | 149M (1992) |
| 24 |
 Romania |
18,912,567 | −0.57% | −107,704 | 2024 | 23.2M (1990) |
| 25 |
 Dominica |
65,501 | −0.56% | −370 | 2016 | 73.1K (1980) |
| 26 |
 Japan |
122,704,252 | −0.54% | −662,482 | 2011 | 128M (2010) |
| 27 |
 Taiwan |
23,228,408 | −0.52% | −121,268 | 2025 | 23.6M (2019) |
| 28 |
 North Macedonia |
1,811,466 | −0.52% | −9,443 | 2004 | 2.06M (1990) |
| 29 |
 Tonga |
103,283 | −0.44% | −459 | 2021 | 108K (2011) |
| 30 |
 Greece |
10,371,575 | −0.41% | −42,387 | 2026 | 11.1M (2010) |
| 31 |
 Cuba |
10,893,750 | −0.4% | −43,453 | 2013 | 11.3M (2012) |
| 32 |
 Italy |
58,708,169 | −0.35% | −207,487 | 2015 | 60.3M (2014) |
| 33 |
 Palau |
17,620 | −0.24% | −43 | 2019 | 19.8K (2004) |
| 34 |
 Mauritius |
1,240,721 | −0.24% | −3,020 | 2022 | 1.27M (2021) |
| 35 |
 China |
1,403,335,670 | −0.23% | −3,249,330 | 2022 | 1.41B (2021) |
| 36 |
 Portugal |
10,788,071 | −0.16% | −16,800 | 2026 | 10.8M (2025) |
| 37 |
 South Korea |
51,624,449 | −0.12% | −60,115 | 2025 | 51.8M (2020) |
| 38 |
 Slovenia |
2,128,778 | −0.1% | −2,208 | 2026 | 2.13M (2025) |
| 39 |
 Jamaica |
2,834,177 | −0.1% | −2,900 | 2024 | 2.84M (2023) |
| 40 |
 Thailand |
71,565,981 | −0.08% | −53,882 | 2023 | 71.7M (2022) |
| 41 |
 Austria |
9,201,502 | −0.07% | −6,661 | 2026 | 9.21M (2025) |
| 42 |
 Nepal |
29,598,041 | −0.07% | −20,077 | 2023 | 29.7M (2022) |
| 43 |
 Spain |
49,323,658 | −0.06% | −31,485 | 2026 | 49.4M (2025) |
| 44 |
 Uruguay |
3,382,672 | −0.06% | −2,016 | 2021 | 3.4M (2020) |
| 45 |
 Georgia |
3,934,050 | −0.04% | −1,716 | 2026 | 4.91M (1993) |
| 46 |
 Curacao |
156,236 | −0.02% | −27 | 2026 | 160K (2017) |
| Rank | Country | Change, % | Births minus deaths (2024) | Net migration (2024) |
|---|---|---|---|---|
| 1 |
Marshall Islands
|
−3.42% | +487 | −1,765 |
| 2 |
Tuvalu
|
−1.51% | +122 | −280 |
| 3 |
Montenegro
|
−1.5% | +624 | −1,686 |
| 4 |
Lithuania
|
−1.49% | −18,485 | +2,617 |
| 5 |
Estonia
|
−1.42% | −6,038 | −7,742 |
| 6 |
Moldova
|
−1.35% | −7,767 | −27,088 |
| 7 |
Czech Republic
|
−1.33% | −28,353 | −86,169 |
| 8 |
Poland
|
−1.18% | −157,205 | −238,062 |
| 9 |
Latvia
|
−1.13% | −13,809 | −2,225 |
| 10 |
Jordan
|
−0.94% | +200,223 | −156,369 |
| 11 |
Bosnia
|
−0.81% | −18,359 | −4,497 |
| 12 |
Germany
|
−0.79% | −334,066 | +36,954 |
| 13 |
Monaco
|
−0.75% | −409 | +110 |
| 14 |
Serbia
|
−0.75% | −37,543 | −8,132 |
| 15 |
Albania
|
−0.74% | +3,979 | −24,472 |
| 16 |
Armenia
|
−0.73% | +8,190 | −29,966 |
| 17 |
Slovakia
|
−0.69% | −7,591 | −21,027 |
| 18 |
Croatia
|
−0.68% | −18,944 | −5,186 |
| 19 |
Saint Vincent
|
−0.68% | +42 | −737 |
| 20 |
Bulgaria
|
−0.67% | −47,023 | +524 |
| 21 |
Belarus
|
−0.66% | −55,755 | −3,119 |
| 22 |
Hungary
|
−0.63% | −49,723 | +16,223 |
| 23 |
Russia
|
−0.61% | −574,678 | −178,042 |
| 24 |
Romania
|
−0.57% | −100,975 | −28,466 |
| 25 |
Dominica
|
−0.56% | −109 | −200 |
| 26 |
Japan
|
−0.54% | −942,213 | +153,357 |
| 27 |
Taiwan
|
−0.52% | −92,465 (2025) | −8,632 (2025) |
| 28 |
North Macedonia
|
−0.52% | −4,196 | −5,728 |
| 29 |
Tonga
|
−0.44% | +1,729 | −2,149 |
| 30 |
Greece
|
−0.41% | −57,229 | −122,772 |
| 31 |
Cuba
|
−0.4% | −19,270 | −22,356 |
| 32 |
Italy
|
−0.35% | −277,077 | +95,246 |
| 33 |
Palau
|
−0.24% | −18 | −14 |
| 34 |
Mauritius
|
−0.24% | +374 | −2,787 |
| 35 |
China
|
−0.23% | −1,394,886 | −318,992 |
| 36 |
Portugal
|
−0.16% | −34,223 | +20,648 |
| 37 |
South Korea
|
−0.12% | −119,027 | +75,963 |
| 38 |
Slovenia
|
−0.1% | −4,680 | +3,319 |
| 39 |
Jamaica
|
−0.1% | +9,210 | −10,506 |
| 40 |
Thailand
|
−0.08% | −65,720 | +23,321 |
| 41 |
Austria
|
−0.07% | −11,013 | +8,813 |
| 42 |
Nepal
|
−0.07% | +355,516 | −401,282 |
| 43 |
Spain
|
−0.06% | −117,237 | +111,674 |
| 44 |
Uruguay
|
−0.06% | −443 | −1,348 |
| 45 |
Georgia
|
−0.04% | −2,085 | +1,745 |
| 46 |
Curacao
|
−0.02% | −453 | +513 |
In 2026, the population falls in 46 countries, the fastest in the Marshall Islands, by 3.4% a year. China's population falls by the most people, 3.25 million a year. Hungary's population has fallen every year since 1982, the longest run of the list. Of these 46 countries, 35 have more deaths than births and 31 have more people leaving than moving in; 20 have both.
A country's population shrinks when deaths outnumber births, when more people leave than move in, or both. The list counts the countries with fewer people than a year earlier: by the World Bank's figures and, after their last year, by the growth of the United Nations' projections (World Population Prospects).
Countries with a declining population map, 1961–2026
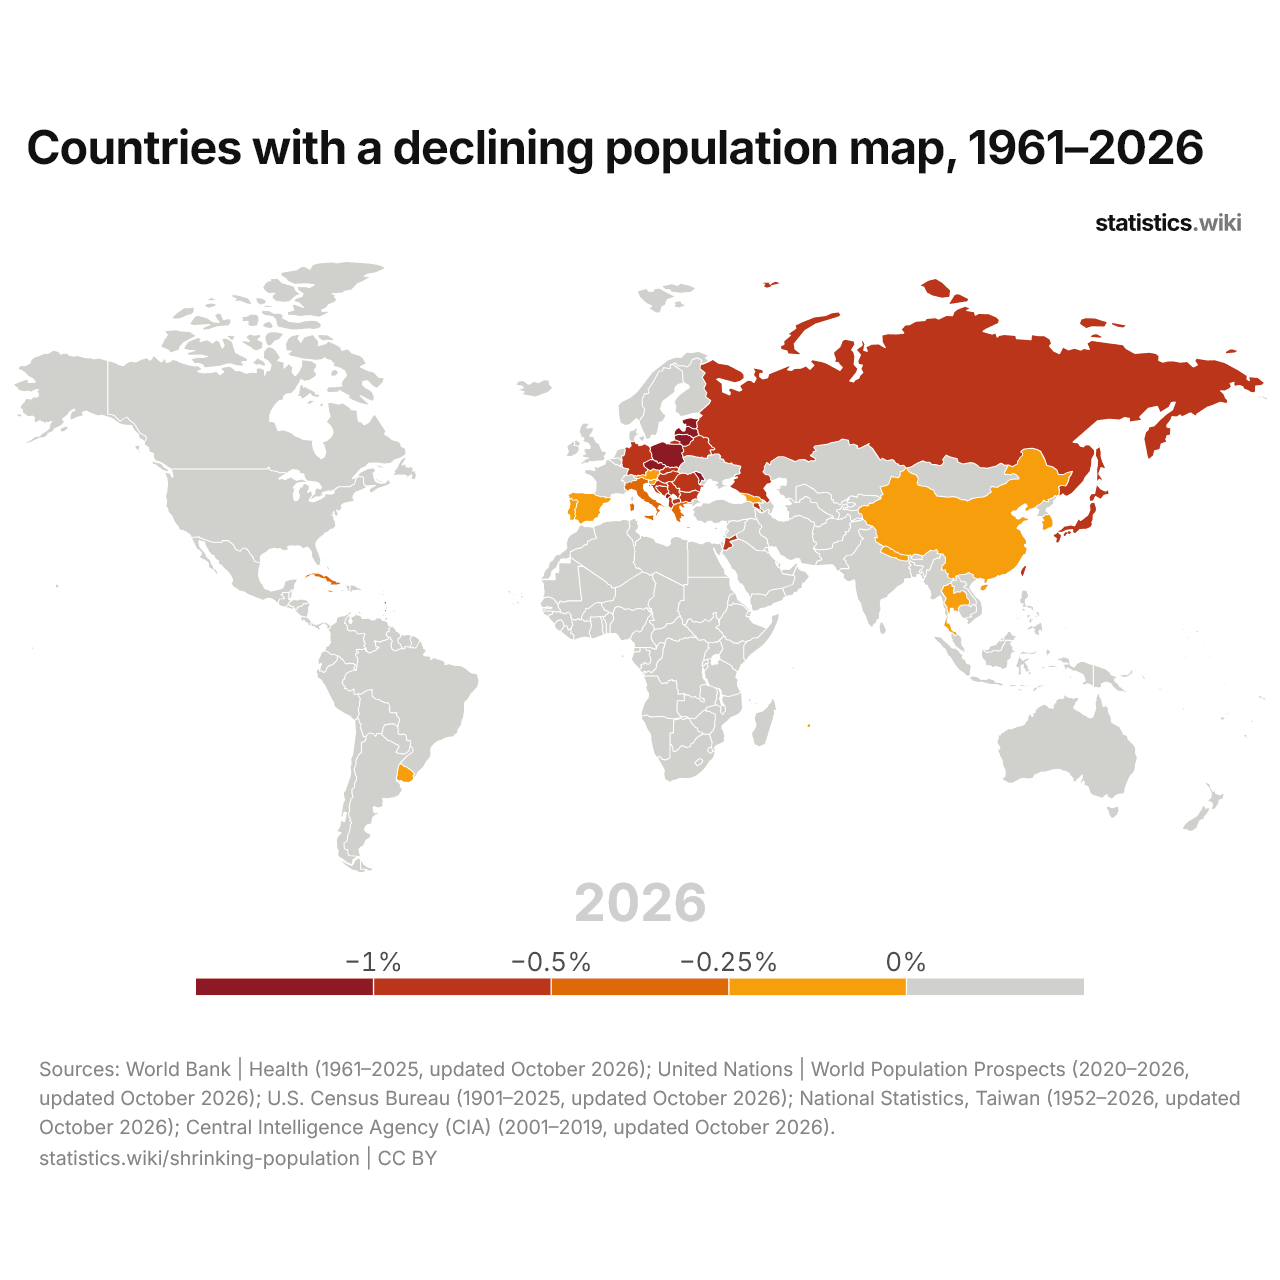
In 2026, the population falls in 46 countries, by more than 1% a year in 9; in 1961 it fell in 5.
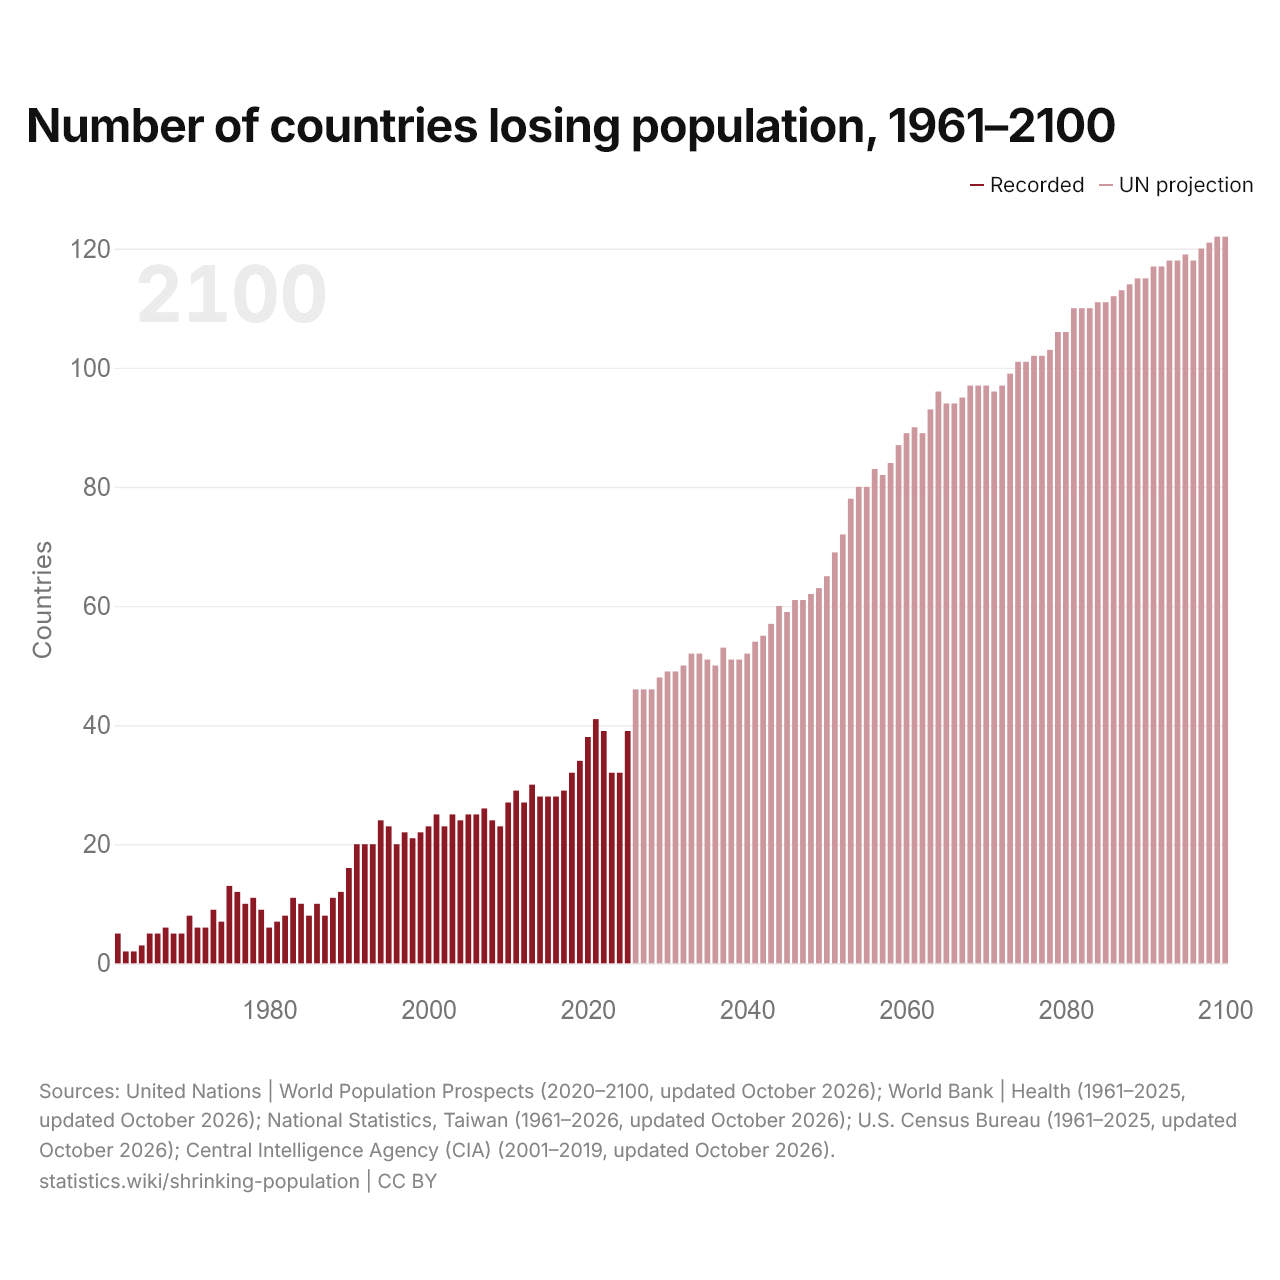
Number of countries losing population, 1961–2100
| Year | Countries |
|---|---|
| 2100 | 122 |
| 2099 | 122 |
| 2098 | 121 |
| 2097 | 120 |
| 2096 | 118 |
| 2095 | 119 |
| 2094 | 118 |
| 2093 | 118 |
| 2092 | 117 |
| 2091 | 117 |
| 2090 | 115 |
| 2089 | 115 |
| 2088 | 114 |
| 2087 | 113 |
| 2086 | 112 |
| 2085 | 111 |
| 2084 | 111 |
| 2083 | 110 |
| 2082 | 110 |
| 2081 | 110 |
| 2080 | 106 |
| 2079 | 106 |
| 2078 | 103 |
| 2077 | 102 |
| 2076 | 102 |
| 2075 | 101 |
| 2074 | 101 |
| 2073 | 99 |
| 2072 | 97 |
| 2071 | 96 |
| 2070 | 97 |
| 2069 | 97 |
| 2068 | 97 |
| 2067 | 95 |
| 2066 | 94 |
| 2065 | 94 |
| 2064 | 96 |
| 2063 | 93 |
| 2062 | 89 |
| 2061 | 90 |
| 2060 | 89 |
| 2059 | 87 |
| 2058 | 84 |
| 2057 | 82 |
| 2056 | 83 |
| 2055 | 80 |
| 2054 | 80 |
| 2053 | 78 |
| 2052 | 72 |
| 2051 | 69 |
| 2050 | 65 |
| 2049 | 63 |
| 2048 | 62 |
| 2047 | 61 |
| 2046 | 61 |
| 2045 | 59 |
| 2044 | 60 |
| 2043 | 57 |
| 2042 | 55 |
| 2041 | 54 |
| 2040 | 52 |
| 2039 | 51 |
| 2038 | 51 |
| 2037 | 53 |
| 2036 | 50 |
| 2035 | 51 |
| 2034 | 52 |
| 2033 | 52 |
| 2032 | 50 |
| 2031 | 49 |
| 2030 | 49 |
| 2029 | 48 |
| 2028 | 46 |
| 2027 | 46 |
| 2026 | 46 |
| 2025 | 39 |
| 2024 | 32 |
| 2023 | 32 |
| 2022 | 39 |
| 2021 | 41 |
| 2020 | 38 |
| 2019 | 34 |
| 2018 | 32 |
| 2017 | 29 |
| 2016 | 28 |
| 2015 | 28 |
| 2014 | 28 |
| 2013 | 30 |
| 2012 | 27 |
| 2011 | 29 |
| 2010 | 27 |
| 2009 | 23 |
| 2008 | 24 |
| 2007 | 26 |
| 2006 | 25 |
| 2005 | 25 |
| 2004 | 24 |
| 2003 | 25 |
| 2002 | 23 |
| 2001 | 25 |
| 2000 | 23 |
| 1999 | 22 |
| 1998 | 21 |
| 1997 | 22 |
| 1996 | 20 |
| 1995 | 23 |
| 1994 | 24 |
| 1993 | 20 |
| 1992 | 20 |
| 1991 | 20 |
| 1990 | 16 |
| 1989 | 12 |
| 1988 | 11 |
| 1987 | 8 |
| 1986 | 10 |
| 1985 | 8 |
| 1984 | 10 |
| 1983 | 11 |
| 1982 | 8 |
| 1981 | 7 |
| 1980 | 6 |
| 1979 | 9 |
| 1978 | 11 |
| 1977 | 10 |
| 1976 | 12 |
| 1975 | 13 |
| 1974 | 7 |
| 1973 | 9 |
| 1972 | 6 |
| 1971 | 6 |
| 1970 | 8 |
| 1969 | 5 |
| 1968 | 5 |
| 1967 | 6 |
| 1966 | 5 |
| 1965 | 5 |
| 1964 | 3 |
| 1963 | 2 |
| 1962 | 2 |
| 1961 | 5 |
The number of countries with a falling population rose from 5 in 1961 to 46 in 2026. The UN projects 65 in 2050 and 122 in 2100.
Countries projected to start shrinking before 2050
| # | Country | Population, 2026 | Change, 2026 | Peak year | Peak population | Population, 2050 | Change, 2026–2050 |
|---|---|---|---|---|---|---|---|
| 1 |
 Ukraine |
40,408,451 | +3.66% | 2026 | 40,408,451 | 32,754,538 | −18.9% |
| 2 |
 Finland |
5,647,947 | +0.03% | 2026 | 5,647,947 | 5,381,479 | −4.72% |
| 3 |
 Trinidad |
1,370,204 | +0.18% | 2028 | 1,372,048 | 1,271,946 | −7.17% |
| 4 |
 Barbados |
282,752 | +0.05% | 2028 | 282,876 | 264,941 | −6.3% |
| 5 |
 Saint Kitts |
46,999 | +0.16% | 2031 | 47,178 | 44,409 | −5.51% |
| 6 |
 North Korea |
26,638,530 | +0.25% | 2032 | 26,835,978 | 25,866,886 | −2.9% |
| 7 |
 Saint Lucia |
180,519 | +0.21% | 2032 | 181,680 | 172,723 | −4.32% |
| 8 |
 Grenada |
117,390 | +0.07% | 2032 | 117,516 | 113,495 | −3.32% |
| 9 |
 Malta |
585,225 | +0.95% | 2034 | 595,017 | 573,186 | −2.06% |
| 10 |
 Andorra |
83,803 | +1.09% | 2036 | 86,689 | 82,860 | −1.13% |
| 11 |
 Antigua |
94,638 | +0.46% | 2039 | 97,412 | 95,442 | +0.85% |
| 12 |
 Singapore |
6,149,680 | +0.63% | 2040 | 6,469,582 | 6,359,963 | +3.42% |
| 13 |
 Chile |
19,949,741 | +0.45% | 2041 | 20,590,850 | 20,390,198 | +2.21% |
| 14 |
 Brazil |
213,593,266 | +0.37% | 2042 | 219,730,173 | 218,102,997 | +2.11% |
| 15 |
 Netherlands |
18,196,186 | +0.6% | 2042 | 18,853,495 | 18,757,302 | +3.08% |
| 16 |
 Denmark |
6,032,411 | +0.39% | 2043 | 6,154,449 | 6,145,108 | +1.87% |
| 17 |
 Seychelles |
124,871 | +1.75% | 2043 | 132,982 | 132,262 | +5.92% |
| 18 |
 San Marino |
34,144 | +0.1% | 2043 | 34,552 | 34,268 | +0.36% |
| 19 |
 Belgium |
11,959,583 | +0.15% | 2045 | 12,096,264 | 12,070,180 | +0.92% |
| 20 |
 Costa Rica |
5,175,408 | +0.44% | 2045 | 5,393,493 | 5,370,484 | +3.77% |
| 21 |
 Turkey |
86,093,293 | +0.25% | 2047 | 89,659,415 | 89,541,520 | +4.01% |
| 22 |
 El Salvador |
6,391,761 | +0.41% | 2048 | 6,683,689 | 6,678,745 | +4.49% |
| 23 |
 Myanmar |
55,193,610 | +0.63% | 2049 | 58,819,125 | 58,813,731 | +6.56% |
Before 2050, 23 countries whose population still grows will start shrinking; the first are Ukraine (peak in 2026), Finland (peak in 2026) and Trinidad and Tobago (peak in 2028). The most populous of them is Brazil, projected to peak at 220 million in 2042.
Sources:
- United Nations | World Population Prospects (2020–2100, updated October 2026), with adjustments by statistics.wiki to match the latest data
- World Bank | Health (1961–2025, updated October 2026)
- U.S. Census Bureau (1901–2025, updated October 2026)
- National Statistics, Taiwan (1952–2026, updated October 2026)
- Central Intelligence Agency (CIA) (2001–2019, updated October 2026)
Creative Commons Attribution (CC BY): you may copy, share, adapt and reuse this content, also commercially, as long as you credit statistics.wiki and note any changes you made. The sources listed above may have their own license terms.