
Projected population by country in 2030, 2050 and 2100
| Rank | Country | Population, 2026 | 2030 | 2050 | 2100 | Change, 2026–2100 | Peak year |
|---|---|---|---|---|---|---|---|
 World |
8.27B | 8.54B | 9.67B | 10.2B | +23.8% | 2085 | |
| 1 |  India |
1.48B | 1.53B | 1.69B | 1.52B | +2.64% | 2062 |
| 2 |  China |
1.4B | 1.39B | 1.26B | 634M | −54.8% | 2021 |
| 3 |  United States |
344M | 350M | 375M | 415M | +20.9% | 2100+ |
| 4 |  Pakistan |
259M | 277M | 373M | 515M | +98.5% | 2100+ |
| 5 |  Nigeria |
242M | 263M | 361M | 482M | +98.6% | 2100+ |
| 6 |  Indonesia |
288M | 296M | 322M | 297M | +3.23% | 2059 |
| 7 |  Ethiopia |
139M | 153M | 226M | 371M | +167.1% | 2100+ |
| 8 |  DR Congo |
116M | 132M | 219M | 436M | +274.5% | 2100+ |
| 9 |  Brazil |
214M | 216M | 218M | 164M | −23.1% | 2042 |
| 10 |  Bangladesh |
178M | 186M | 215M | 210M | +18.3% | 2071 |
| 11 |  Egypt |
120M | 127M | 162M | 203M | +69.3% | 2100+ |
| 12 |  Mexico |
133M | 137M | 149M | 131M | −1.4% | 2059 |
| 13 |  Russia |
143M | 141M | 135M | 126M | −11.9% | 1992 |
| 14 |  Philippines |
118M | 121M | 135M | 115M | −2.27% | 2057 |
| 15 |  Tanzania |
72.6M | 81M | 130M | 265M | +265.8% | 2100+ |
| 16 |  Vietnam |
102M | 104M | 110M | 92.2M | −9.76% | 2050 |
| 17 |  Japan |
123M | 120M | 105M | 77M | −37.3% | 2010 |
| 18 |  Iran |
93.2M | 95.7M | 102M | 80.7M | −13.5% | 2053 |
| 19 |  Turkey |
86.1M | 87.2M | 89.5M | 64.4M | −25.2% | 2047 |
| 20 |  Uganda |
52.8M | 58.4M | 85.9M | 122M | +132% | 2100+ |
| 21 |  Sudan |
53.3M | 58.8M | 85.9M | 139M | +160.3% | 2100+ |
| 22 |  Kenya |
58.6M | 63.1M | 84M | 105M | +79.4% | 2098 |
| 23 |  South Africa |
65.5M | 68.2M | 79.4M | 94.7M | +44.7% | 2100+ |
| 24 |  Germany |
82.8M | 82M | 77.6M | 70.1M | −15.3% | 2024 |
| 25 |  Afghanistan |
45M | 50M | 77.3M | 132M | +192.4% | 2100+ |
| 26 |  United Kingdom |
69.9M | 71.3M | 75.6M | 74.5M | +6.63% | 2073 |
| 27 |  Angola |
40.2M | 45.2M | 74.6M | 152M | +277.3% | 2100+ |
| 28 |  Iraq |
48M | 52M | 72.2M | 102M | +111.6% | 2100+ |
| 29 |  Yemen |
43M | 47.8M | 71.4M | 111M | +159.4% | 2100+ |
| 30 |  France |
68.8M | 69.2M | 70.4M | 70.7M | +2.69% | 2096 |
| 31 |  Thailand |
71.6M | 71.2M | 66.6M | 45.7M | −36.1% | 2022 |
| 32 |  Mozambique |
36.6M | 40.9M | 63.9M | 106M | +188.3% | 2100+ |
| 33 |  Algeria |
48M | 50.2M | 59.7M | 65M | +35.2% | 2091 |
| 34 |  Colombia |
54M | 55.8M | 59.7M | 47.5M | −12% | 2051 |
| 35 |  Myanmar |
55.2M | 56.4M | 58.8M | 49.9M | −9.52% | 2049 |
| 36 |  Ivory Coast |
33.5M | 36.7M | 55.9M | 105M | +213.1% | 2100+ |
| 37 |  Madagascar |
33.5M | 36.7M | 53.4M | 86.2M | +157% | 2100+ |
| 38 |  Niger |
28.8M | 32.6M | 52.8M | 92.1M | +219.6% | 2100+ |
| 39 |  Uzbekistan |
37.7M | 40.3M | 52.4M | 74.9M | +98.5% | 2100+ |
| 40 |  Italy |
58.7M | 57.7M | 51.8M | 35.3M | −39.9% | 2014 |
| 41 |  Cameroon |
30.6M | 33.8M | 51.3M | 89.8M | +192.9% | 2100+ |
| 42 |  Saudi Arabia |
37.6M | 40.1M | 51.2M | 76.4M | +103% | 2100+ |
| 43 |  Ghana |
35.7M | 38.3M | 50.7M | 68.1M | +90.8% | 2100+ |
| 44 |  Argentina |
46M | 46.6M | 48.4M | 38.5M | −16.4% | 2050 |
| 45 |  Canada |
42M | 43.3M | 47.5M | 55.8M | +32.8% | 2100+ |
| 46 |  Spain |
49.3M | 49.1M | 46.4M | 34.2M | −30.6% | 2025 |
| 47 |  Mali |
25.9M | 29M | 46.4M | 80.4M | +209.8% | 2100+ |
| 48 |  South Korea |
51.6M | 51.2M | 45.4M | 22M | −57.4% | 2020 |
| 49 |  Malaysia |
36.4M | 38M | 44.4M | 44.3M | +21.8% | 2073 |
| 50 |  Morocco |
38.8M | 40M | 43.6M | 38.2M | −1.55% | 2058 |
| 51 |  Peru |
34.9M | 36.2M | 40.7M | 38.4M | +10.1% | 2067 |
| 52 |  Chad |
21.6M | 24.2M | 39M | 70.3M | +226.1% | 2100+ |
| 53 |  Syria |
26.5M | 29.6M | 38.3M | 44.5M | +67.7% | 2086 |
| 54 |  Zambia |
22.5M | 25.1M | 38.3M | 65.2M | +189.5% | 2100+ |
| 55 |  Malawi |
22.8M | 25.2M | 37.5M | 59.8M | +162.3% | 2100+ |
| 56 |  Burkina Faso |
24.6M | 26.8M | 37.5M | 50.4M | +104.8% | 2100+ |
| 57 |  Somalia |
20.3M | 23M | 37.4M | 68.3M | +236.5% | 2100+ |
| 58 |  Nepal |
29.6M | 30.4M | 34.6M | 31.9M | +7.83% | 2067 |
| 59 |  Australia |
27.9M | 28.9M | 33.3M | 44.3M | +58.8% | 2100+ |
| 60 |  Ukraine |
40.4M | 39.2M | 32.8M | 15.6M | −61.4% | 1993 |
| 61 |  Poland |
36M | 35.4M | 31.3M | 18.5M | −48.8% | 1998 |
| 62 |  Venezuela |
28.6M | 29.1M | 31.1M | 28.4M | −0.77% | 2057 |
| 63 |  Senegal |
19.4M | 21.2M | 30.5M | 47.5M | +145.1% | 2100+ |
| 64 |  Kazakhstan |
21.1M | 22M | 26.6M | 33.8M | +60.4% | 2100+ |
| 65 |  Zimbabwe |
17.3M | 18.6M | 25.9M | 37.5M | +117% | 2100+ |
| 66 |  North Korea |
26.6M | 26.8M | 25.9M | 19.6M | −26.4% | 2032 |
| 67 |  Guatemala |
19M | 20.1M | 24.8M | 26.2M | +37.9% | 2078 |
| 68 |  Benin |
15.2M | 16.6M | 24.5M | 40M | +163.5% | 2100+ |
| 69 |  Burundi |
14.7M | 16.2M | 24.2M | 38.3M | +159.8% | 2100+ |
| 70 |  Guinea |
15.4M | 16.8M | 23.5M | 32.4M | +109.5% | 2100+ |
| 71 |  Sri Lanka |
21.9M | 22.3M | 23.3M | 20M | −8.51% | 2051 |
| 72 |  Rwanda |
14.9M | 16.2M | 22.8M | 33.1M | +122.3% | 2100+ |
| 73 |  Cambodia |
18.1M | 18.8M | 22M | 22.9M | +26.8% | 2078 |
| 74 |  Ecuador |
18.4M | 19.1M | 21.4M | 19.2M | +4.25% | 2063 |
| 75 |  Chile |
19.9M | 20.2M | 20.4M | 13.5M | −32.1% | 2041 |
| 76 |  Taiwan |
23.2M | 22.8M | 19.7M | 10.1M | −56.3% | 2019 |
| 77 |  Netherlands |
18.2M | 18.5M | 18.8M | 17.3M | −4.76% | 2042 |
| 78 |  South Sudan |
12.4M | 13.5M | 18.4M | 24.1M | +93.6% | 2100+ |
| 79 |  Jordan |
11.4M | 12.3M | 16.2M | 21.2M | +85.8% | 2100+ |
| 80 |  Bolivia |
12.8M | 13.4M | 16.2M | 17.9M | +40.3% | 2087 |
| 81 |  Romania |
18.9M | 18.5M | 16.1M | 10.8M | −42.7% | 1990 |
| 82 |  UAE |
11.8M | 12.4M | 15.7M | 26.7M | +126.7% | 2100+ |
| 83 |  Tajikistan |
11M | 11.7M | 15.6M | 20.4M | +85.6% | 2100+ |
| 84 |  Papua New Guinea |
11M | 11.7M | 15M | 18.8M | +71.7% | 2100+ |
| 85 |  Honduras |
11.2M | 11.9M | 14.9M | 17.2M | +53.6% | 2090 |
| 86 |  Haiti |
12M | 12.6M | 14.8M | 15.3M | +26.7% | 2076 |
| 87 |  Israel |
10.3M | 10.8M | 13.9M | 21.1M | +105.6% | 2100+ |
| 88 |  Togo |
8.78M | 9.54M | 13.8M | 23.4M | +166.9% | 2100+ |
| 89 |  Tunisia |
12.4M | 12.6M | 13.2M | 10.7M | −13.7% | 2052 |
| 90 |  Dominican Republic |
11.6M | 11.9M | 13M | 11.8M | +1.22% | 2061 |
| 91 |  Sierra Leone |
9M | 9.71M | 13M | 16.1M | +79% | 2093 |
| 92 |  Belgium |
12M | 12M | 12.1M | 11.3M | −5.93% | 2045 |
| 93 |  Sweden |
10.6M | 10.8M | 11.3M | 11.3M | +6.46% | 2080 |
| 94 |  Azerbaijan |
10.3M | 10.5M | 11.1M | 9.92M | −3.73% | 2051 |
| 95 |  Congo |
6.64M | 7.28M | 11M | 20.2M | +204.2% | 2100+ |
| 96 |  CAR |
5.7M | 6.49M | 10.7M | 19.1M | +234.4% | 2100+ |
| 97 |  Portugal |
10.8M | 10.7M | 10.1M | 9.08M | −15.8% | 2025 |
| 98 |  Czech Republic |
10.7M | 10.6M | 10M | 8.4M | −21.8% | 2024 |
| 99 |  Laos |
7.98M | 8.37M | 9.8M | 9.34M | +17.1% | 2068 |
| 100 |  Kyrgyzstan |
7.45M | 7.86M | 9.74M | 11.9M | +59.6% | 2100+ |
| 101 |  Turkmenistan |
7.74M | 8.16M | 9.69M | 10M | +29.7% | 2079 |
| 102 |  Switzerland |
9.14M | 9.27M | 9.49M | 9.27M | +1.5% | 2052 |
| 103 |  Mauritania |
5.46M | 6.07M | 9.46M | 17.3M | +216.7% | 2100+ |
| 104 |  Cuba |
10.9M | 10.7M | 9.4M | 5.6M | −48.6% | 2012 |
| 105 |  Libya |
7.54M | 7.88M | 9.28M | 9.84M | +30.6% | 2087 |
| 106 |  Greece |
10.4M | 10.2M | 9.24M | 6.58M | −36.5% | 2010 |
| 107 |  Liberia |
5.85M | 6.37M | 8.95M | 12.8M | +118.5% | 2100+ |
| 108 |  Austria |
9.2M | 9.18M | 8.83M | 7.48M | −18.7% | 2025 |
| 109 |  Nicaragua |
7.1M | 7.45M | 8.79M | 8.69M | +22.4% | 2072 |
| 110 |  Paraguay |
7.1M | 7.41M | 8.67M | 9.11M | +28.4% | 2078 |
| 111 |  Hungary |
9.45M | 9.32M | 8.61M | 7.35M | −22.2% | 1981 |
| 112 |  Palestine |
5.51M | 5.93M | 8.21M | 11.2M | +103.6% | 2100+ |
| 113 |  Oman |
5.69M | 6.18M | 7.92M | 12.3M | +115.6% | 2100+ |
| 114 |  Belarus |
9.03M | 8.78M | 7.53M | 4.4M | −51.2% | 1993 |
| 115 |  Lebanon |
5.9M | 6.1M | 7.01M | 7.23M | +22.7% | 2080 |
| 116 |  El Salvador |
6.39M | 6.49M | 6.68M | 5.11M | −20.1% | 2048 |
| 117 |  Singapore |
6.15M | 6.28M | 6.36M | 4.37M | −29% | 2040 |
| 118 |  Ireland |
5.54M | 5.72M | 6.2M | 5.5M | −0.66% | 2053 |
| 119 |  Kuwait |
4.95M | 5.17M | 6.19M | 9.33M | +88.7% | 2100+ |
| 120 |  Denmark |
6.03M | 6.1M | 6.15M | 5.88M | −2.45% | 2043 |
| 121 |  Norway |
5.65M | 5.73M | 5.91M | 5.43M | −3.95% | 2051 |
| 122 |  New Zealand |
5.36M | 5.49M | 5.85M | 5.92M | +10.3% | 2078 |
| 123 |  Eritrea |
3.68M | 4M | 5.72M | 8.52M | +131.4% | 2100+ |
| 124 |  Panama |
4.63M | 4.84M | 5.65M | 5.95M | +28.5% | 2081 |
| 125 |  Serbia |
6.5M | 6.33M | 5.42M | 3.62M | −44.2% | 1990 |
| 126 |  Finland |
5.65M | 5.62M | 5.38M | 4.63M | −18% | 2026 |
| 127 |  Costa Rica |
5.18M | 5.25M | 5.37M | 3.8M | −26.5% | 2045 |
| 128 |  Bulgaria |
6.39M | 6.19M | 5.18M | 3.38M | −47% | 1988 |
| 129 |  Slovakia |
5.38M | 5.33M | 4.88M | 3.39M | −37% | 2020 |
| 130 |  Mongolia |
3.61M | 3.76M | 4.58M | 5.63M | +56% | 2100+ |
| 131 |  Namibia |
3.15M | 3.39M | 4.53M | 5.95M | +88.7% | 2100+ |
| 132 |  Gambia |
2.88M | 3.13M | 4.32M | 5.77M | +99.9% | 2100+ |
| 133 |  Gabon |
2.65M | 2.87M | 4.1M | 6.95M | +162.6% | 2100+ |
| 134 |  Qatar |
3.03M | 3.2M | 3.99M | 6.97M | +129.9% | 2100+ |
| 135 |  Georgia |
3.93M | 3.92M | 3.79M | 3.08M | −21.8% | 1993 |
| 136 |  Guinea-Bissau |
2.3M | 2.49M | 3.45M | 4.71M | +105.1% | 2100+ |
| 137 |  Botswana |
2.6M | 2.77M | 3.45M | 3.87M | +48.7% | 2088 |
| 138 |  Croatia |
3.85M | 3.75M | 3.26M | 2.16M | −43.9% | 1990 |
| 139 |  Uruguay |
3.38M | 3.37M | 3.26M | 2.26M | −33.3% | 2020 |
| 140 |  Equatorial Guinea |
1.99M | 2.17M | 3.16M | 5.05M | +154.5% | 2100+ |
| 141 |  Lesotho |
2.39M | 2.49M | 3M | 3.28M | +37.3% | 2083 |
| 142 |  Armenia |
3.06M | 2.98M | 2.61M | 1.77M | −42.3% | 1991 |
| 143 |  Jamaica |
2.83M | 2.81M | 2.47M | 1.08M | −62% | 2023 |
| 144 |  Bosnia |
3.11M | 3.01M | 2.46M | 1.37M | −56.1% | 1991 |
| 145 |  Lithuania |
2.85M | 2.75M | 2.3M | 1.23M | −56.7% | 1991 |
| 146 |  Bahrain |
1.63M | 1.73M | 2.1M | 3.03M | +85.5% | 2100+ |
| 147 |  Slovenia |
2.13M | 2.11M | 2M | 1.64M | −22.8% | 2025 |
| 148 |  Albania |
2.33M | 2.27M | 1.9M | 1.01M | −56.8% | 1990 |
| 149 |  East Timor |
1.44M | 1.52M | 1.89M | 1.99M | +38.4% | 2077 |
| 150 |  Moldova |
2.33M | 2.24M | 1.85M | 1.17M | −49.8% | 1991 |
| 151 |  Djibouti |
1.2M | 1.26M | 1.54M | 1.85M | +54.5% | 2100+ |
| 152 |  North Macedonia |
1.81M | 1.77M | 1.52M | 870K | −52% | 1990 |
| 153 |  Cyprus |
1.38M | 1.42M | 1.51M | 1.28M | −7.21% | 2052 |
| 154 |  Eswatini |
1.27M | 1.32M | 1.51M | 1.35M | +6.52% | 2063 |
| 155 |  Latvia |
1.83M | 1.77M | 1.51M | 922K | −49.5% | 1989 |
| 156 |  Solomon Islands |
858K | 939K | 1.32M | 1.87M | +117.7% | 2100+ |
| 157 |  Comoros |
899K | 965K | 1.31M | 1.93M | +114.2% | 2100+ |
| 158 |  Trinidad |
1.37M | 1.37M | 1.27M | 818K | −40.3% | 2028 |
| 159 |  Estonia |
1.35M | 1.32M | 1.19M | 836K | −37.9% | 1990 |
| 160 |  Mauritius |
1.24M | 1.23M | 1.09M | 574K | −53.8% | 2021 |
| 161 |  Fiji |
937K | 953K | 1M | 884K | −5.74% | 2054 |
| 162 |  Guyana |
841K | 861K | 942K | 893K | +6.24% | 2067 |
| 163 |  Bhutan |
802K | 821K | 885K | 695K | −13.3% | 2052 |
| 164 |  Luxembourg |
694K | 721K | 802K | 760K | +9.48% | 2062 |
| 165 |  Suriname |
645K | 666K | 736K | 713K | +10.5% | 2072 |
| 166 |  Maldives |
532K | 540K | 590K | 476K | −10.4% | 2058 |
| 167 |  Malta |
585K | 592K | 573K | 386K | −34.1% | 2034 |
| 168 |  Cape Verde |
530K | 539K | 567K | 420K | −20.7% | 2052 |
| 169 |  Vanuatu |
343K | 373K | 536K | 883K | +157.7% | 2100+ |
| 170 |  Montenegro |
614K | 600K | 523K | 320K | −47.8% | 2019 |
| 171 |  Brunei |
470K | 483K | 521K | 467K | −0.54% | 2055 |
| 172 |  Belize |
429K | 450K | 519K | 452K | +5.44% | 2063 |
| 173 |  Iceland |
397K | 409K | 429K | 360K | −9.24% | 2050 |
| 174 |  Bahamas |
405K | 410K | 425K | 386K | −4.56% | 2050 |
| 175 |  Sao Tome |
245K | 265K | 366K | 539K | +119.8% | 2100+ |
| 176 |  Samoa |
221K | 226K | 272K | 384K | +74.1% | 2100+ |
| 177 |  Barbados |
283K | 283K | 265K | 195K | −30.9% | 2028 |
| 178 |  Kiribati |
138K | 146K | 183K | 224K | +62% | 2100+ |
| 179 |  Saint Lucia |
181K | 181K | 173K | 109K | −39.7% | 2032 |
| 180 |  Curacao |
156K | 156K | 146K | 102K | −34.8% | 2017 |
| 181 |  Seychelles |
125K | 131K | 132K | 108K | −13.3% | 2043 |
| 182 |  Grenada |
117K | 118K | 113K | 74.3K | −36.7% | 2032 |
| 183 |  Tonga |
103K | 102K | 105K | 118K | +13.9% | 2100+ |
| 184 |  Cayman Islands |
77.2K | 82.5K | 104K | 119K | +54.3% | 2098 |
| 185 |  Antigua |
94.6K | 96.1K | 95.4K | 68.4K | −27.7% | 2039 |
| 186 |  Saint Vincent |
99.2K | 96.8K | 88.9K | 64.2K | −35.3% | 2000 |
| 187 |  Andorra |
83.8K | 86K | 82.9K | 47.8K | −43% | 2036 |
| 188 |  Dominica |
65.5K | 64.1K | 63.1K | 49.2K | −24.9% | 1980 |
| 189 |  Saint Kitts |
47K | 47.2K | 44.4K | 30.4K | −35.4% | 1960 |
| 190 |  Liechtenstein |
41.3K | 42.2K | 44.1K | 44.7K | +8.32% | 2100+ |
| 191 |  Monaco |
38.1K | 37.3K | 36.6K | 47.2K | +23.9% | 2100+ |
| 192 |  San Marino |
34.1K | 34.3K | 34.3K | 31.7K | −7.2% | 2020 |
| 193 |  Marshall Islands |
35K | 31.1K | 24.8K | 23.4K | −33.1% | 2010 |
| 194 |  Nauru |
12.1K | 12.5K | 15.7K | 20.7K | +71.1% | 2100+ |
| 195 |  Palau |
17.6K | 17.4K | 15.6K | 11.1K | −36.7% | 2004 |
| 196 |  Tuvalu |
9.35K | 9K | 9.67K | 12.2K | +30.1% | 2100+ |
| 197 |  Vatican |
933 | 979 | 1.31K | 2.52K | +170.2% | 2100+ |
By the UN's projections, the most populous countries in 2050 will be India (1.69 billion), China (1.26 billion) and the United States (375 million). From 2026 to 2100, the population is projected to grow in 112 of the 197 countries and to fall in 85; the largest rise is in Angola (280%), the largest fall in Jamaica (62%). In 45 countries the population peaked in 2026 or earlier; 74 are still growing in 2100.
The UN's population projections (World Population Prospects) start from each country's population by age and project its births, deaths and migration year by year. The figures up to 2025 are the World Bank's estimates; the later years follow the UN's projected change up to 2100.
World population projection, 1960–2100
| Year | Population |
|---|---|
| 2100 projected | 10,242,977,771 |
| 2099 projected | 10,254,749,895 |
| 2098 projected | 10,265,789,288 |
| 2097 projected | 10,276,054,258 |
| 2096 projected | 10,285,551,410 |
| 2095 projected | 10,294,296,079 |
| 2094 projected | 10,302,225,787 |
| 2093 projected | 10,309,376,439 |
| 2092 projected | 10,315,735,660 |
| 2091 projected | 10,321,322,309 |
| 2090 projected | 10,326,147,235 |
| 2089 projected | 10,330,203,798 |
| 2088 projected | 10,333,474,982 |
| 2087 projected | 10,335,945,693 |
| 2086 projected | 10,337,565,984 |
| 2085 projected | 10,338,310,010 |
| 2084 projected | 10,338,123,165 |
| 2083 projected | 10,336,997,754 |
| 2082 projected | 10,334,853,102 |
| 2081 projected | 10,331,712,642 |
| 2080 projected | 10,327,458,190 |
| 2079 projected | 10,322,073,234 |
| 2078 projected | 10,315,522,812 |
| 2077 projected | 10,307,746,970 |
| 2076 projected | 10,298,806,930 |
| 2075 projected | 10,288,701,095 |
| 2074 projected | 10,277,425,577 |
| 2073 projected | 10,265,003,797 |
| 2072 projected | 10,251,477,761 |
| 2071 projected | 10,236,839,745 |
| 2070 projected | 10,221,161,840 |
| 2069 projected | 10,204,463,777 |
| 2068 projected | 10,186,726,961 |
| 2067 projected | 10,167,973,111 |
| 2066 projected | 10,148,220,593 |
| 2065 projected | 10,127,495,984 |
| 2064 projected | 10,105,762,451 |
| 2063 projected | 10,083,019,622 |
| 2062 projected | 10,059,219,498 |
| 2061 projected | 10,034,313,480 |
| 2060 projected | 10,008,219,178 |
| 2059 projected | 9,980,877,149 |
| 2058 projected | 9,952,212,121 |
| 2057 projected | 9,922,152,146 |
| 2056 projected | 9,890,621,442 |
| 2055 projected | 9,857,587,336 |
| 2054 projected | 9,822,974,393 |
| 2053 projected | 9,786,640,089 |
| 2052 projected | 9,748,600,466 |
| 2051 projected | 9,708,816,663 |
| 2050 projected | 9,667,303,263 |
| 2049 projected | 9,624,044,273 |
| 2048 projected | 9,579,068,901 |
| 2047 projected | 9,532,397,854 |
| 2046 projected | 9,484,095,978 |
| 2045 projected | 9,434,270,082 |
| 2044 projected | 9,382,951,743 |
| 2043 projected | 9,330,247,234 |
| 2042 projected | 9,276,241,709 |
| 2041 projected | 9,220,974,132 |
| 2040 projected | 9,164,454,817 |
| 2039 projected | 9,106,883,190 |
| 2038 projected | 9,048,175,985 |
| 2037 projected | 8,988,478,022 |
| 2036 projected | 8,927,696,751 |
| 2035 projected | 8,865,946,001 |
| 2034 projected | 8,803,291,041 |
| 2033 projected | 8,739,751,711 |
| 2032 projected | 8,675,333,952 |
| 2031 projected | 8,610,013,487 |
| 2030 projected | 8,543,831,107 |
| 2029 projected | 8,476,839,928 |
| 2028 projected | 8,409,001,503 |
| 2027 projected | 8,340,315,283 |
| 2026 projected | 8,270,710,548 |
| 2025 | 8,200,695,269 |
| 2024 | 8,126,105,992 |
| 2023 | 8,048,015,531 |
| 2022 | 7,973,901,887 |
| 2021 | 7,904,638,345 |
| 2020 | 7,838,732,812 |
| 2019 | 7,762,136,625 |
| 2018 | 7,681,209,021 |
| 2017 | 7,598,794,539 |
| 2016 | 7,513,230,170 |
| 2015 | 7,426,080,158 |
| 2014 | 7,338,554,017 |
| 2013 | 7,250,454,314 |
| 2012 | 7,161,585,843 |
| 2011 | 7,071,903,701 |
| 2010 | 6,985,459,913 |
| 2009 | 6,901,447,716 |
| 2008 | 6,815,345,933 |
| 2007 | 6,729,368,557 |
| 2006 | 6,644,911,563 |
| 2005 | 6,560,843,556 |
| 2004 | 6,477,839,701 |
| 2003 | 6,394,914,981 |
| 2002 | 6,312,737,329 |
| 2001 | 6,230,364,871 |
| 2000 | 6,146,517,482 |
| 1999 | 6,063,812,089 |
| 1998 | 5,979,372,835 |
| 1997 | 5,893,829,210 |
| 1996 | 5,808,113,330 |
| 1995 | 5,722,361,877 |
| 1994 | 5,636,907,535 |
| 1993 | 5,551,081,183 |
| 1992 | 5,463,638,647 |
| 1991 | 5,375,147,930 |
| 1990 | 5,285,139,275 |
| 1989 | 5,196,469,221 |
| 1988 | 5,106,050,452 |
| 1987 | 5,015,979,629 |
| 1986 | 4,926,742,491 |
| 1985 | 4,839,853,160 |
| 1984 | 4,755,237,871 |
| 1983 | 4,672,226,745 |
| 1982 | 4,588,973,408 |
| 1981 | 4,506,469,835 |
| 1980 | 4,426,601,725 |
| 1979 | 4,349,398,065 |
| 1978 | 4,273,043,302 |
| 1977 | 4,198,674,192 |
| 1976 | 4,125,548,977 |
| 1975 | 4,051,893,564 |
| 1974 | 3,977,215,588 |
| 1973 | 3,901,110,167 |
| 1972 | 3,824,571,369 |
| 1971 | 3,748,609,429 |
| 1970 | 3,669,669,585 |
| 1969 | 3,594,542,705 |
| 1968 | 3,520,495,930 |
| 1967 | 3,449,035,635 |
| 1966 | 3,379,383,758 |
| 1965 | 3,309,696,298 |
| 1964 | 3,242,251,340 |
| 1963 | 3,175,300,144 |
| 1962 | 3,108,842,209 |
| 1961 | 3,054,557,387 |
| 1960 | 3,012,817,230 |
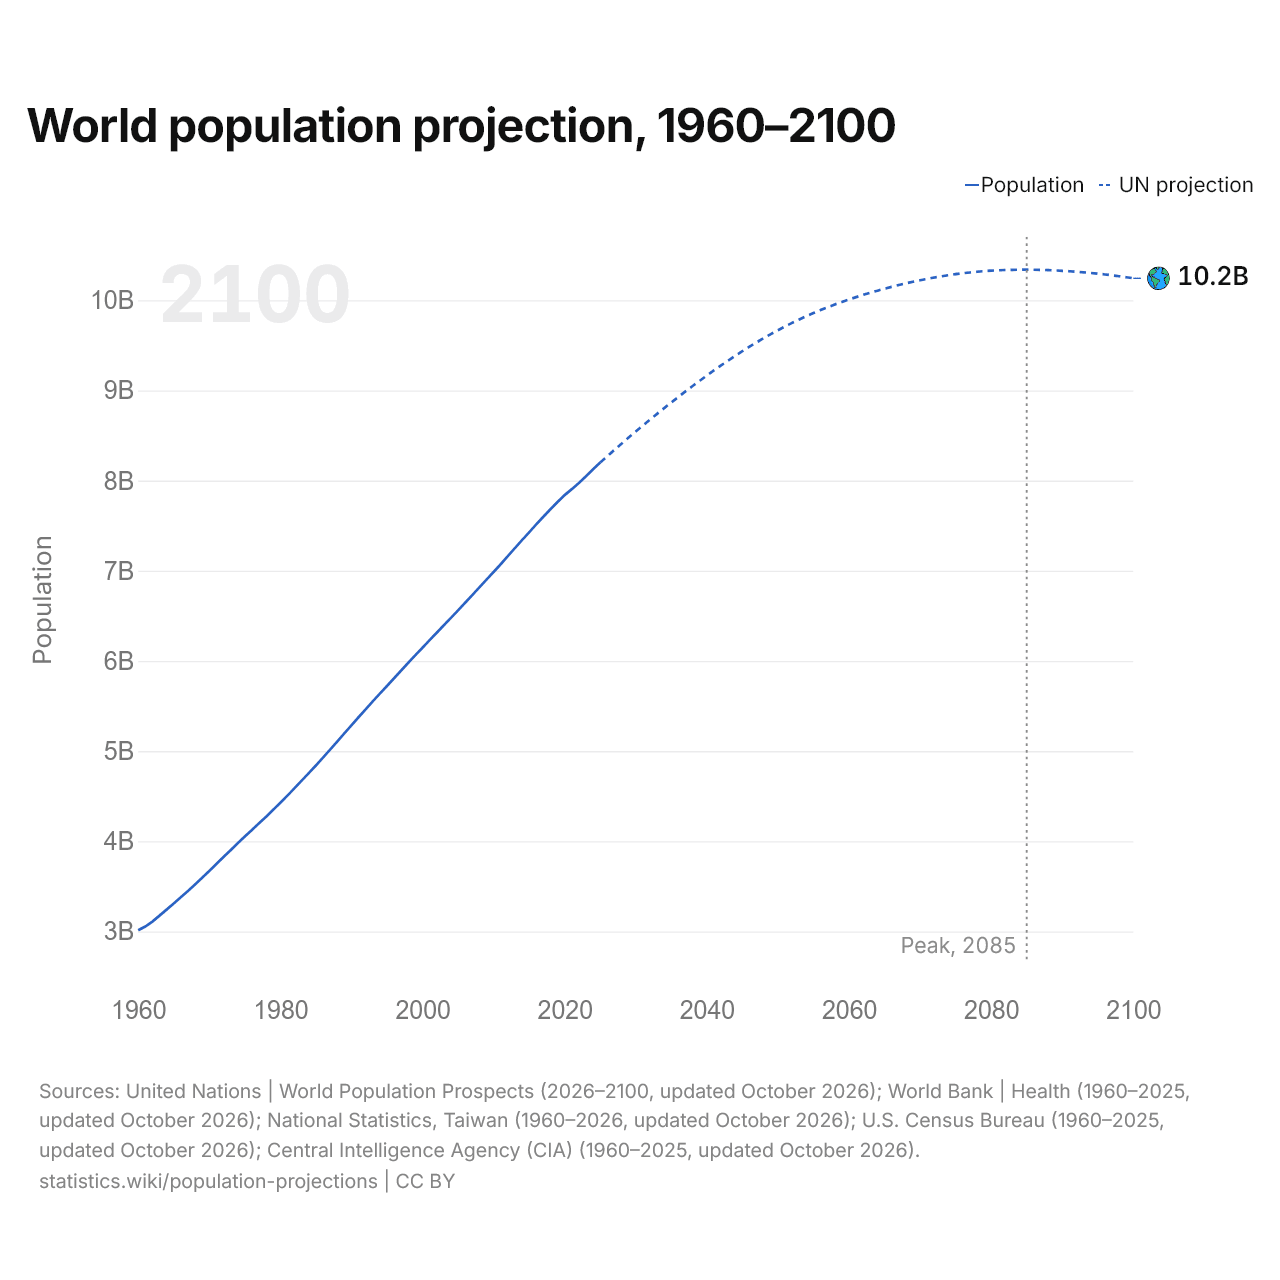
The world population is 8.27 billion in 2026. The UN projects it to peak at 10.3 billion in 2085 and to be 10.2 billion in 2100.
Population projection by region, 1960–2100
| Year | Population | |||||
|---|---|---|---|---|---|---|
| Asia | Africa | Europe | Latin America | North America | Oceania | |
| 2100 projected | 4,641,181,660 | 3,848,050,828 | 594,203,338 | 614,890,843 | 471,239,312 | 73,411,790 |
| 2099 projected | 4,662,901,916 | 3,833,735,648 | 595,885,623 | 618,595,567 | 470,455,801 | 73,175,340 |
| 2098 projected | 4,684,559,234 | 3,818,788,084 | 597,533,176 | 622,309,341 | 469,668,890 | 72,930,563 |
| 2097 projected | 4,706,073,751 | 3,803,293,690 | 599,180,018 | 626,021,079 | 468,819,317 | 72,666,403 |
| 2096 projected | 4,727,444,566 | 3,787,144,773 | 600,829,018 | 629,732,718 | 467,997,356 | 72,402,979 |
| 2095 projected | 4,748,635,402 | 3,770,514,291 | 602,440,163 | 633,435,790 | 467,125,960 | 72,144,473 |
| 2094 projected | 4,769,695,720 | 3,753,275,961 | 604,008,874 | 637,122,854 | 466,234,219 | 71,888,159 |
| 2093 projected | 4,790,579,648 | 3,735,443,057 | 605,585,183 | 640,796,436 | 465,354,972 | 71,617,143 |
| 2092 projected | 4,811,273,509 | 3,717,025,317 | 607,198,630 | 644,437,268 | 464,463,908 | 71,337,028 |
| 2091 projected | 4,831,848,207 | 3,697,995,045 | 608,802,189 | 648,059,250 | 463,567,354 | 71,050,264 |
| 2090 projected | 4,852,321,454 | 3,678,242,093 | 610,451,980 | 651,656,679 | 462,716,036 | 70,758,993 |
| 2089 projected | 4,872,682,524 | 3,657,876,159 | 612,107,290 | 655,220,301 | 461,838,691 | 70,478,833 |
| 2088 projected | 4,892,831,443 | 3,637,053,417 | 613,757,759 | 658,743,048 | 460,904,295 | 70,185,020 |
| 2087 projected | 4,912,788,882 | 3,615,534,905 | 615,440,225 | 662,230,414 | 460,048,346 | 69,902,921 |
| 2086 projected | 4,932,649,540 | 3,593,249,383 | 617,176,483 | 665,678,027 | 459,188,382 | 69,624,169 |
| 2085 projected | 4,952,115,783 | 3,570,447,938 | 618,943,698 | 669,070,149 | 458,382,179 | 69,350,263 |
| 2084 projected | 4,971,233,169 | 3,547,180,399 | 620,723,974 | 672,399,141 | 457,509,525 | 69,076,957 |
| 2083 projected | 4,990,144,075 | 3,523,257,949 | 622,524,996 | 675,669,113 | 456,614,581 | 68,787,040 |
| 2082 projected | 5,008,586,286 | 3,498,794,125 | 624,366,313 | 678,880,876 | 455,722,487 | 68,503,015 |
| 2081 projected | 5,026,662,673 | 3,473,847,935 | 626,224,709 | 682,034,569 | 454,736,677 | 68,206,079 |
| 2080 projected | 5,044,144,534 | 3,448,289,654 | 628,150,266 | 685,117,738 | 453,842,882 | 67,913,116 |
| 2079 projected | 5,061,099,475 | 3,422,167,826 | 630,143,401 | 688,122,992 | 452,919,852 | 67,619,688 |
| 2078 projected | 5,077,670,360 | 3,395,372,289 | 632,177,157 | 691,049,043 | 451,934,367 | 67,319,596 |
| 2077 projected | 5,093,607,197 | 3,368,011,200 | 634,281,111 | 693,886,369 | 450,946,241 | 67,014,852 |
| 2076 projected | 5,108,902,225 | 3,340,261,093 | 636,396,033 | 696,630,258 | 449,902,370 | 66,714,951 |
| 2075 projected | 5,123,719,974 | 3,311,910,784 | 638,567,581 | 699,287,408 | 448,805,625 | 66,409,723 |
| 2074 projected | 5,137,836,686 | 3,283,031,616 | 640,846,196 | 701,851,305 | 447,759,947 | 66,099,827 |
| 2073 projected | 5,151,294,259 | 3,253,734,116 | 643,177,765 | 704,328,041 | 446,679,660 | 65,789,956 |
| 2072 projected | 5,164,273,287 | 3,223,894,676 | 645,538,987 | 706,699,899 | 445,595,750 | 65,475,162 |
| 2071 projected | 5,176,685,386 | 3,193,593,778 | 647,984,058 | 708,970,837 | 444,444,545 | 65,161,141 |
| 2070 projected | 5,188,474,175 | 3,162,899,419 | 650,479,698 | 711,142,870 | 443,327,555 | 64,838,123 |
| 2069 projected | 5,199,801,720 | 3,131,753,944 | 653,035,510 | 713,202,979 | 442,164,041 | 64,505,583 |
| 2068 projected | 5,210,518,084 | 3,100,225,598 | 655,637,367 | 715,152,305 | 441,027,119 | 64,166,488 |
| 2067 projected | 5,220,844,789 | 3,068,176,805 | 658,276,221 | 716,986,946 | 439,864,431 | 63,823,919 |
| 2066 projected | 5,230,529,146 | 3,035,779,155 | 660,985,302 | 718,710,200 | 438,738,496 | 63,478,294 |
| 2065 projected | 5,239,661,717 | 3,002,969,064 | 663,764,070 | 720,315,728 | 437,646,936 | 63,138,469 |
| 2064 projected | 5,248,245,096 | 2,969,762,574 | 666,575,842 | 721,788,244 | 436,587,007 | 62,803,688 |
| 2063 projected | 5,256,244,121 | 2,936,246,052 | 669,416,402 | 723,142,101 | 435,512,438 | 62,458,508 |
| 2062 projected | 5,263,651,509 | 2,902,358,887 | 672,279,057 | 724,368,908 | 434,449,880 | 62,111,257 |
| 2061 projected | 5,270,526,619 | 2,867,983,018 | 675,163,572 | 725,463,649 | 433,412,656 | 61,763,966 |
| 2060 projected | 5,276,528,920 | 2,833,376,316 | 678,034,407 | 726,431,915 | 432,435,211 | 61,412,409 |
| 2059 projected | 5,281,813,295 | 2,798,363,792 | 680,934,347 | 727,264,776 | 431,443,625 | 61,057,314 |
| 2058 projected | 5,286,099,243 | 2,763,243,314 | 683,803,980 | 727,945,518 | 430,432,686 | 60,687,380 |
| 2057 projected | 5,289,348,299 | 2,727,874,782 | 686,634,501 | 728,499,057 | 429,474,101 | 60,321,406 |
| 2056 projected | 5,291,592,295 | 2,692,165,808 | 689,434,590 | 728,903,955 | 428,571,428 | 59,953,366 |
| 2055 projected | 5,292,787,030 | 2,656,181,611 | 692,193,805 | 729,159,760 | 427,691,136 | 59,573,994 |
| 2054 projected | 5,292,895,330 | 2,619,986,744 | 694,837,010 | 729,271,150 | 426,794,507 | 59,189,652 |
| 2053 projected | 5,291,713,323 | 2,583,627,100 | 697,419,664 | 729,230,387 | 425,842,249 | 58,807,366 |
| 2052 projected | 5,289,452,499 | 2,547,002,453 | 699,824,398 | 729,023,059 | 424,876,207 | 58,421,850 |
| 2051 projected | 5,285,959,801 | 2,510,124,736 | 702,161,434 | 728,667,153 | 423,877,751 | 58,025,788 |
| 2050 projected | 5,281,057,296 | 2,473,206,443 | 704,406,174 | 728,142,665 | 422,864,126 | 57,626,559 |
| 2049 projected | 5,274,806,795 | 2,436,112,379 | 706,580,246 | 727,480,932 | 421,838,822 | 57,225,099 |
| 2048 projected | 5,267,374,689 | 2,398,833,478 | 708,642,597 | 726,637,773 | 420,773,655 | 56,806,709 |
| 2047 projected | 5,258,699,813 | 2,361,396,324 | 710,625,785 | 725,630,322 | 419,647,174 | 56,398,436 |
| 2046 projected | 5,248,727,497 | 2,323,921,558 | 712,512,148 | 724,460,980 | 418,500,857 | 55,972,938 |
| 2045 projected | 5,237,604,060 | 2,286,360,137 | 714,354,205 | 723,128,145 | 417,276,283 | 55,547,252 |
| 2044 projected | 5,225,390,144 | 2,248,657,842 | 716,153,148 | 721,616,746 | 416,011,480 | 55,122,383 |
| 2043 projected | 5,212,137,880 | 2,210,873,300 | 717,918,850 | 719,937,870 | 414,684,800 | 54,694,534 |
| 2042 projected | 5,197,902,097 | 2,173,110,362 | 719,613,611 | 718,077,619 | 413,277,683 | 54,260,337 |
| 2041 projected | 5,182,611,716 | 2,135,326,815 | 721,298,227 | 716,048,929 | 411,863,140 | 53,825,305 |
| 2040 projected | 5,166,280,164 | 2,097,550,910 | 722,988,523 | 713,841,132 | 410,401,849 | 53,392,239 |
| 2039 projected | 5,149,014,552 | 2,059,830,022 | 724,710,032 | 711,476,026 | 408,892,143 | 52,960,415 |
| 2038 projected | 5,130,835,554 | 2,022,197,929 | 726,382,244 | 708,939,742 | 407,302,854 | 52,517,662 |
| 2037 projected | 5,111,765,961 | 1,984,633,548 | 728,052,801 | 706,260,340 | 405,686,969 | 52,078,403 |
| 2036 projected | 5,091,747,267 | 1,947,145,529 | 729,704,642 | 703,427,439 | 404,043,305 | 51,628,569 |
| 2035 projected | 5,070,905,999 | 1,909,734,108 | 731,315,535 | 700,439,336 | 402,374,338 | 51,176,685 |
| 2034 projected | 5,049,204,738 | 1,872,525,674 | 732,893,553 | 697,303,226 | 400,639,662 | 50,724,188 |
| 2033 projected | 5,026,557,358 | 1,835,547,041 | 734,443,919 | 694,034,154 | 398,901,443 | 50,267,796 |
| 2032 projected | 5,003,070,450 | 1,798,737,911 | 735,971,103 | 690,629,274 | 397,118,423 | 49,806,791 |
| 2031 projected | 4,978,716,144 | 1,762,066,044 | 737,510,252 | 687,085,385 | 395,299,148 | 49,336,514 |
| 2030 projected | 4,953,509,006 | 1,725,680,013 | 738,928,398 | 683,410,164 | 393,445,066 | 48,858,460 |
| 2029 projected | 4,927,534,321 | 1,689,497,394 | 740,268,292 | 679,603,985 | 391,559,873 | 48,376,063 |
| 2028 projected | 4,900,764,550 | 1,653,592,267 | 741,500,027 | 675,674,697 | 389,589,903 | 47,880,059 |
| 2027 projected | 4,873,208,456 | 1,617,885,654 | 742,630,949 | 671,593,733 | 387,620,381 | 47,376,110 |
| 2026 projected | 4,844,942,994 | 1,582,261,660 | 743,651,103 | 667,394,609 | 385,593,170 | 46,867,012 |
| 2025 | 4,816,667,057 | 1,546,877,498 | 744,330,603 | 663,039,707 | 383,436,510 | 46,343,894 |
| 2024 | 4,786,047,539 | 1,512,196,879 | 742,310,117 | 658,615,236 | 381,266,126 | 45,670,095 |
| 2023 | 4,754,180,764 | 1,477,881,002 | 740,278,472 | 654,045,002 | 376,804,140 | 44,826,151 |
| 2022 | 4,722,028,127 | 1,444,092,389 | 741,467,325 | 649,520,085 | 372,946,436 | 43,847,525 |
| 2021 | 4,690,491,056 | 1,411,047,316 | 743,857,959 | 645,605,207 | 370,340,030 | 43,296,777 |
| 2020 | 4,660,850,555 | 1,378,199,852 | 745,335,082 | 641,847,404 | 369,477,919 | 43,022,000 |
| 2019 | 4,623,316,581 | 1,345,445,900 | 745,867,316 | 637,289,596 | 367,844,722 | 42,372,510 |
| 2018 | 4,583,929,713 | 1,312,909,768 | 744,957,330 | 632,119,542 | 365,602,197 | 41,690,471 |
| 2017 | 4,543,423,558 | 1,280,484,750 | 744,107,439 | 626,639,688 | 363,153,684 | 40,985,420 |
| 2016 | 4,499,688,591 | 1,248,883,959 | 743,064,539 | 620,893,494 | 360,464,143 | 40,235,444 |
| 2015 | 4,454,777,293 | 1,217,838,276 | 741,467,322 | 614,971,734 | 357,519,619 | 39,505,914 |
| 2014 | 4,409,162,995 | 1,187,068,953 | 739,901,313 | 608,907,561 | 354,691,626 | 38,821,569 |
| 2013 | 4,362,474,575 | 1,156,712,420 | 738,612,773 | 602,699,535 | 351,807,274 | 38,147,737 |
| 2012 | 4,314,334,020 | 1,126,841,422 | 737,478,716 | 596,412,202 | 349,052,494 | 37,466,989 |
| 2011 | 4,264,549,277 | 1,098,199,053 | 736,128,526 | 590,051,592 | 346,178,682 | 36,796,571 |
| 2010 | 4,216,211,428 | 1,070,305,249 | 736,304,183 | 583,689,781 | 342,751,440 | 36,197,832 |
| 2009 | 4,170,075,034 | 1,042,878,126 | 735,225,856 | 577,311,912 | 340,401,598 | 35,555,190 |
| 2008 | 4,122,395,410 | 1,016,183,514 | 733,786,206 | 570,815,735 | 337,341,264 | 34,823,804 |
| 2007 | 4,074,555,345 | 990,197,701 | 732,138,302 | 564,233,999 | 334,120,093 | 34,123,117 |
| 2006 | 4,027,137,758 | 965,105,836 | 730,627,733 | 557,622,309 | 330,951,105 | 33,466,822 |
| 2005 | 3,978,895,561 | 940,755,470 | 729,548,236 | 550,979,692 | 327,759,331 | 32,905,266 |
| 2004 | 3,930,813,754 | 917,025,683 | 728,559,833 | 544,314,483 | 324,744,105 | 32,381,843 |
| 2003 | 3,882,236,900 | 894,023,406 | 727,515,986 | 537,508,054 | 321,750,394 | 31,880,241 |
| 2002 | 3,833,404,283 | 871,739,622 | 726,695,778 | 530,562,716 | 318,984,392 | 31,350,538 |
| 2001 | 3,783,492,489 | 850,057,869 | 726,532,415 | 523,451,920 | 315,989,810 | 30,840,368 |
| 2000 | 3,732,096,016 | 828,996,678 | 726,800,813 | 516,162,543 | 312,107,636 | 30,353,796 |
| 1999 | 3,680,192,628 | 808,543,422 | 727,100,584 | 508,634,695 | 309,441,454 | 29,899,306 |
| 1998 | 3,627,490,656 | 788,495,111 | 727,037,591 | 500,877,744 | 306,009,277 | 29,462,456 |
| 1997 | 3,573,331,924 | 768,949,687 | 726,911,984 | 493,046,951 | 302,552,873 | 29,035,791 |
| 1996 | 3,518,502,738 | 750,066,618 | 726,729,503 | 485,224,209 | 299,004,502 | 28,585,760 |
| 1995 | 3,463,638,663 | 731,305,285 | 726,378,945 | 477,344,168 | 295,580,704 | 28,114,112 |
| 1994 | 3,408,725,035 | 713,124,041 | 725,855,981 | 469,401,386 | 292,126,484 | 27,674,608 |
| 1993 | 3,353,387,833 | 695,263,816 | 725,114,194 | 461,438,026 | 288,603,352 | 27,273,962 |
| 1992 | 3,297,310,821 | 677,243,616 | 723,903,953 | 453,395,146 | 284,885,488 | 26,899,623 |
| 1991 | 3,240,147,491 | 659,822,004 | 722,351,476 | 445,308,848 | 281,018,361 | 26,499,750 |
| 1990 | 3,182,459,760 | 642,527,237 | 720,614,388 | 437,170,751 | 276,401,011 | 25,966,128 |
| 1989 | 3,124,250,234 | 625,147,378 | 718,435,546 | 428,980,461 | 274,096,011 | 25,559,591 |
| 1988 | 3,065,049,920 | 608,209,914 | 715,530,488 | 420,817,848 | 271,290,729 | 25,151,553 |
| 1987 | 3,005,713,960 | 591,458,375 | 712,641,065 | 412,662,503 | 268,735,519 | 24,768,207 |
| 1986 | 2,946,908,193 | 574,855,942 | 709,818,399 | 404,539,082 | 266,233,165 | 24,387,710 |
| 1985 | 2,889,995,005 | 558,583,693 | 707,043,593 | 396,414,663 | 263,765,911 | 24,050,295 |
| 1984 | 2,834,873,679 | 542,602,665 | 704,343,185 | 388,271,816 | 261,431,955 | 23,714,571 |
| 1983 | 2,780,555,450 | 527,257,505 | 701,723,587 | 380,134,749 | 259,158,445 | 23,397,009 |
| 1982 | 2,725,761,967 | 512,044,302 | 699,256,758 | 372,085,301 | 256,781,400 | 23,043,680 |
| 1981 | 2,671,990,386 | 496,748,115 | 696,617,670 | 364,175,089 | 254,285,629 | 22,652,946 |
| 1980 | 2,621,318,207 | 482,203,679 | 693,396,787 | 356,308,099 | 251,061,472 | 22,313,481 |
| 1979 | 2,571,934,900 | 468,375,978 | 689,822,558 | 348,458,564 | 248,768,544 | 22,037,521 |
| 1978 | 2,523,229,534 | 454,742,992 | 686,532,456 | 340,679,173 | 246,058,203 | 21,800,944 |
| 1977 | 2,475,523,335 | 441,893,205 | 683,243,045 | 332,986,371 | 243,485,843 | 21,542,393 |
| 1976 | 2,428,172,542 | 429,753,817 | 679,886,172 | 325,440,509 | 241,012,808 | 21,283,129 |
| 1975 | 2,380,168,204 | 417,699,100 | 676,367,319 | 318,023,566 | 238,608,275 | 21,027,100 |
| 1974 | 2,330,770,958 | 406,137,264 | 672,767,500 | 310,678,675 | 236,149,969 | 20,711,222 |
| 1973 | 2,279,578,902 | 395,099,181 | 668,962,962 | 303,399,233 | 233,848,777 | 20,221,112 |
| 1972 | 2,227,497,190 | 384,600,915 | 664,888,103 | 296,205,949 | 231,502,463 | 19,876,749 |
| 1971 | 2,176,000,192 | 374,626,969 | 660,578,991 | 289,112,581 | 228,789,032 | 19,501,664 |
| 1970 | 2,122,379,765 | 364,872,544 | 656,807,974 | 282,127,433 | 224,535,926 | 18,945,943 |
| 1969 | 2,069,952,833 | 355,347,266 | 653,039,088 | 275,208,609 | 222,413,000 | 18,581,909 |
| 1968 | 2,019,075,933 | 346,127,091 | 648,602,013 | 268,324,596 | 220,143,000 | 18,223,297 |
| 1967 | 1,970,386,938 | 337,237,745 | 644,128,205 | 261,501,072 | 217,869,000 | 17,912,675 |
| 1966 | 1,923,236,675 | 328,693,426 | 639,455,023 | 254,734,529 | 215,624,000 | 17,640,105 |
| 1965 | 1,876,016,640 | 320,496,734 | 634,694,182 | 248,032,066 | 213,204,000 | 17,252,676 |
| 1964 | 1,831,852,400 | 312,572,883 | 629,040,939 | 241,405,493 | 210,466,000 | 16,913,625 |
| 1963 | 1,788,336,146 | 304,901,660 | 623,170,056 | 234,876,326 | 207,447,000 | 16,568,956 |
| 1962 | 1,744,955,463 | 297,501,670 | 617,287,823 | 228,475,122 | 204,385,000 | 16,237,131 |
| 1961 | 1,713,437,567 | 290,363,830 | 611,423,820 | 222,226,709 | 201,263,000 | 15,842,461 |
| 1960 | 1,694,733,381 | 283,499,189 | 605,680,924 | 216,158,759 | 197,232,531 | 15,512,446 |
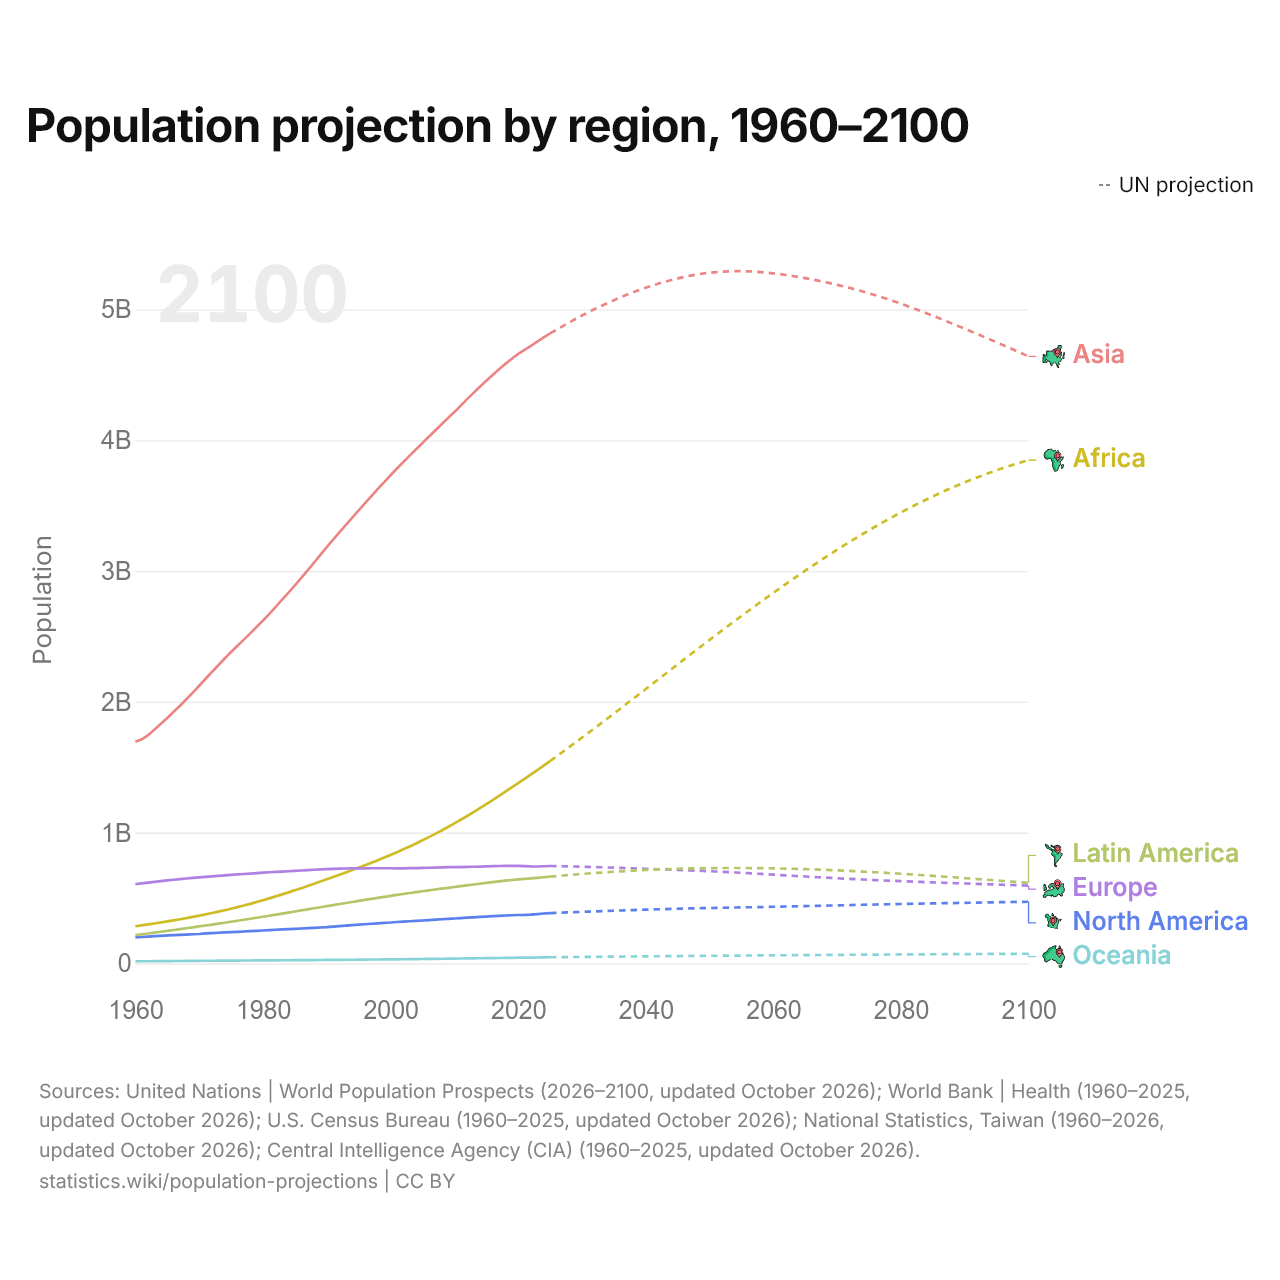
By the UN's projections, Asia will have 45% of the world's population in 2100 (59% in 2026), Africa 38% (19%) and Latin America 6.0% (8.1%). The population of two regions is projected to peak before 2100: Asia in 2054 and Latin America in 2054.
The 5 most populated countries, 1960–2100
| Year | Population | ||||
|---|---|---|---|---|---|
| India | China | Pakistan | Nigeria | DR Congo | |
| 2100 projected | 1,515,764,791 | 633,662,382 | 514,639,086 | 481,640,156 | 436,237,219 |
| 2099 projected | 1,523,450,562 | 644,307,192 | 513,762,873 | 481,456,918 | 433,289,774 |
| 2098 projected | 1,531,147,367 | 655,044,881 | 512,834,641 | 481,181,892 | 430,252,622 |
| 2097 projected | 1,538,780,583 | 665,876,462 | 511,842,588 | 480,838,161 | 427,149,320 |
| 2096 projected | 1,546,380,447 | 676,803,171 | 510,743,323 | 480,422,467 | 423,961,963 |
| 2095 projected | 1,553,964,615 | 687,828,883 | 509,544,194 | 479,938,579 | 420,678,721 |
| 2094 projected | 1,561,496,245 | 698,966,872 | 508,236,117 | 479,395,022 | 417,304,547 |
| 2093 projected | 1,568,975,448 | 710,235,681 | 506,871,405 | 478,769,369 | 413,867,290 |
| 2092 projected | 1,576,332,553 | 721,640,723 | 505,433,117 | 478,059,864 | 410,362,003 |
| 2091 projected | 1,583,655,135 | 733,187,178 | 503,929,591 | 477,236,907 | 406,763,717 |
| 2090 projected | 1,590,899,630 | 744,903,105 | 502,369,089 | 476,329,495 | 403,089,566 |
| 2089 projected | 1,598,026,427 | 756,812,472 | 500,764,988 | 475,326,347 | 399,334,389 |
| 2088 projected | 1,605,029,461 | 768,893,004 | 499,040,109 | 474,231,442 | 395,507,774 |
| 2087 projected | 1,611,883,136 | 781,128,909 | 497,294,229 | 473,035,563 | 391,613,249 |
| 2086 projected | 1,618,654,560 | 793,508,970 | 495,416,407 | 471,732,001 | 387,639,503 |
| 2085 projected | 1,625,282,641 | 806,043,039 | 493,469,269 | 470,328,175 | 383,604,733 |
| 2084 projected | 1,631,712,094 | 818,709,832 | 491,457,322 | 468,806,172 | 379,495,246 |
| 2083 projected | 1,637,989,363 | 831,420,518 | 489,327,293 | 467,187,453 | 375,330,369 |
| 2082 projected | 1,644,062,886 | 844,177,036 | 487,086,584 | 465,472,417 | 371,124,615 |
| 2081 projected | 1,649,962,836 | 856,996,835 | 484,774,651 | 463,643,190 | 366,878,238 |
| 2080 projected | 1,655,654,966 | 869,821,040 | 482,358,125 | 461,705,493 | 362,574,665 |
| 2079 projected | 1,661,116,882 | 882,622,985 | 479,913,540 | 459,644,523 | 358,227,097 |
| 2078 projected | 1,666,332,415 | 895,372,147 | 477,377,443 | 457,477,264 | 353,821,014 |
| 2077 projected | 1,671,298,348 | 908,082,676 | 474,692,907 | 455,218,871 | 349,368,182 |
| 2076 projected | 1,676,004,895 | 920,776,984 | 471,877,807 | 452,849,991 | 344,866,731 |
| 2075 projected | 1,680,459,350 | 933,459,600 | 468,953,317 | 450,367,356 | 340,338,504 |
| 2074 projected | 1,684,595,952 | 946,141,456 | 465,972,364 | 447,789,885 | 335,761,691 |
| 2073 projected | 1,688,431,647 | 958,870,128 | 462,907,667 | 445,117,028 | 331,157,281 |
| 2072 projected | 1,691,990,872 | 971,639,931 | 459,752,452 | 442,340,440 | 326,505,656 |
| 2071 projected | 1,695,203,041 | 984,469,009 | 456,518,761 | 439,464,323 | 321,830,769 |
| 2070 projected | 1,698,107,519 | 997,391,342 | 453,190,545 | 436,505,329 | 317,104,580 |
| 2069 projected | 1,700,664,858 | 1,010,450,818 | 449,749,441 | 433,437,998 | 312,349,776 |
| 2068 projected | 1,702,876,723 | 1,023,633,867 | 446,219,879 | 430,286,232 | 307,566,932 |
| 2067 projected | 1,704,723,837 | 1,036,979,285 | 442,632,987 | 427,032,499 | 302,762,490 |
| 2066 projected | 1,706,198,000 | 1,050,453,924 | 438,970,919 | 423,702,640 | 297,932,241 |
| 2065 projected | 1,707,391,009 | 1,064,051,499 | 435,260,675 | 420,285,359 | 293,081,284 |
| 2064 projected | 1,708,212,818 | 1,077,787,979 | 431,484,424 | 416,778,394 | 288,211,987 |
| 2063 projected | 1,708,696,045 | 1,091,571,021 | 427,665,121 | 413,198,800 | 283,315,009 |
| 2062 projected | 1,708,862,369 | 1,105,429,748 | 423,724,764 | 409,551,159 | 278,399,192 |
| 2061 projected | 1,708,717,131 | 1,119,286,514 | 419,759,602 | 405,827,482 | 273,464,914 |
| 2060 projected | 1,708,195,453 | 1,133,115,260 | 415,724,868 | 402,041,765 | 268,520,814 |
| 2059 projected | 1,707,339,651 | 1,146,818,251 | 411,662,239 | 398,197,311 | 263,570,338 |
| 2058 projected | 1,706,165,210 | 1,160,340,554 | 407,514,159 | 394,284,767 | 258,622,778 |
| 2057 projected | 1,704,656,327 | 1,173,596,480 | 403,318,028 | 390,311,065 | 253,685,085 |
| 2056 projected | 1,702,865,262 | 1,186,578,041 | 399,031,614 | 386,267,580 | 248,748,321 |
| 2055 projected | 1,700,741,939 | 1,199,197,172 | 394,728,055 | 382,162,992 | 243,814,854 |
| 2054 projected | 1,698,325,374 | 1,211,403,028 | 390,385,410 | 378,000,511 | 238,885,417 |
| 2053 projected | 1,695,513,304 | 1,223,160,257 | 386,003,289 | 373,769,779 | 233,971,468 |
| 2052 projected | 1,692,384,182 | 1,234,474,716 | 381,568,312 | 369,472,476 | 229,073,420 |
| 2051 projected | 1,688,910,288 | 1,245,255,938 | 377,096,921 | 365,120,741 | 224,197,775 |
| 2050 projected | 1,685,088,884 | 1,255,501,171 | 372,554,619 | 360,706,317 | 219,354,949 |
| 2049 projected | 1,680,936,533 | 1,265,281,319 | 367,986,189 | 356,243,287 | 214,547,398 |
| 2048 projected | 1,676,430,514 | 1,274,572,888 | 363,386,382 | 351,724,743 | 209,774,448 |
| 2047 projected | 1,671,532,064 | 1,283,393,445 | 358,734,325 | 347,142,279 | 205,040,532 |
| 2046 projected | 1,666,226,180 | 1,291,830,414 | 354,003,639 | 342,505,549 | 200,341,405 |
| 2045 projected | 1,660,522,084 | 1,299,855,379 | 349,228,953 | 337,807,869 | 195,693,533 |
| 2044 projected | 1,654,412,346 | 1,307,510,531 | 344,443,561 | 333,050,132 | 191,087,342 |
| 2043 projected | 1,647,924,060 | 1,314,885,869 | 339,631,894 | 328,230,652 | 186,534,055 |
| 2042 projected | 1,640,993,579 | 1,322,032,311 | 334,801,403 | 323,363,366 | 182,033,706 |
| 2041 projected | 1,633,629,291 | 1,328,936,491 | 329,944,530 | 318,443,989 | 177,583,290 |
| 2040 projected | 1,625,848,393 | 1,335,577,799 | 325,107,264 | 313,468,061 | 173,191,594 |
| 2039 projected | 1,617,677,625 | 1,341,989,157 | 320,203,920 | 308,450,008 | 168,846,440 |
| 2038 projected | 1,609,097,629 | 1,348,134,255 | 315,273,196 | 303,399,842 | 164,551,895 |
| 2037 projected | 1,600,073,012 | 1,354,107,817 | 310,377,446 | 298,327,800 | 160,316,591 |
| 2036 projected | 1,590,593,050 | 1,359,866,705 | 305,472,156 | 293,227,654 | 156,099,100 |
| 2035 projected | 1,580,726,905 | 1,365,387,904 | 300,604,245 | 288,115,630 | 151,924,296 |
| 2034 projected | 1,570,491,868 | 1,370,679,807 | 295,748,602 | 282,995,818 | 147,782,785 |
| 2033 projected | 1,559,906,905 | 1,375,744,986 | 290,911,874 | 277,875,880 | 143,684,929 |
| 2032 projected | 1,548,963,391 | 1,380,528,766 | 286,130,352 | 272,747,599 | 139,642,368 |
| 2031 projected | 1,537,676,208 | 1,385,048,521 | 281,410,647 | 267,645,657 | 135,634,548 |
| 2030 projected | 1,526,059,268 | 1,389,269,809 | 276,766,735 | 262,562,767 | 131,685,113 |
| 2029 projected | 1,514,142,607 | 1,393,241,425 | 272,246,760 | 257,484,616 | 127,793,612 |
| 2028 projected | 1,501,971,477 | 1,396,917,178 | 267,784,548 | 252,445,821 | 123,956,913 |
| 2027 projected | 1,489,498,223 | 1,400,271,033 | 263,445,027 | 247,437,680 | 120,188,952 |
| 2026 projected | 1,476,782,637 | 1,403,335,670 | 259,285,315 | 242,458,365 | 116,482,769 |
| 2025 | 1,463,865,525 | 1,406,585,000 | 255,219,554 | 237,527,782 | 112,832,473 |
| 2024 | 1,450,935,791 | 1,408,975,000 | 251,269,164 | 232,679,478 | 109,276,265 |
| 2023 | 1,438,069,596 | 1,410,710,000 | 247,504,495 | 227,882,945 | 105,789,731 |
| 2022 | 1,425,423,212 | 1,412,175,000 | 243,700,667 | 223,150,896 | 102,396,968 |
| 2021 | 1,414,203,896 | 1,412,360,000 | 239,477,801 | 218,529,286 | 99,148,932 |
| 2020 | 1,402,617,695 | 1,411,100,000 | 235,001,746 | 213,996,181 | 95,989,998 |
| 2019 | 1,389,030,312 | 1,407,745,000 | 230,800,899 | 209,485,641 | 92,947,442 |
| 2018 | 1,374,659,064 | 1,402,760,000 | 226,928,892 | 204,938,755 | 90,047,644 |
| 2017 | 1,359,657,400 | 1,396,215,000 | 223,273,967 | 200,254,579 | 87,083,398 |
| 2016 | 1,343,944,296 | 1,387,790,000 | 220,138,869 | 195,443,700 | 83,956,415 |
| 2015 | 1,328,024,498 | 1,379,860,000 | 217,290,883 | 190,671,878 | 81,035,531 |
| 2014 | 1,312,277,191 | 1,371,860,000 | 214,264,647 | 185,896,915 | 78,403,242 |
| 2013 | 1,295,829,511 | 1,363,240,000 | 211,073,978 | 181,049,443 | 75,789,395 |
| 2012 | 1,278,674,502 | 1,354,190,000 | 207,667,125 | 176,200,625 | 73,254,618 |
| 2011 | 1,261,224,954 | 1,345,035,000 | 203,746,065 | 171,379,598 | 70,849,311 |
| 2010 | 1,243,481,564 | 1,337,705,000 | 199,239,047 | 166,642,886 | 68,563,038 |
| 2009 | 1,225,524,753 | 1,331,260,000 | 194,376,534 | 162,049,464 | 66,412,044 |
| 2008 | 1,207,930,964 | 1,324,655,000 | 189,499,113 | 157,595,014 | 64,390,664 |
| 2007 | 1,190,676,021 | 1,317,885,000 | 184,493,231 | 153,267,261 | 62,477,752 |
| 2006 | 1,172,878,890 | 1,311,020,000 | 179,682,690 | 149,077,334 | 60,615,908 |
| 2005 | 1,154,676,322 | 1,303,720,000 | 175,453,212 | 145,017,253 | 58,775,724 |
| 2004 | 1,135,991,513 | 1,296,075,000 | 171,286,000 | 141,057,045 | 56,997,741 |
| 2003 | 1,116,803,006 | 1,288,400,000 | 167,110,248 | 137,202,644 | 55,343,867 |
| 2002 | 1,097,600,380 | 1,280,400,000 | 163,222,549 | 133,471,989 | 53,750,524 |
| 2001 | 1,077,898,575 | 1,271,850,000 | 159,270,907 | 129,862,595 | 52,132,646 |
| 2000 | 1,057,922,733 | 1,262,645,000 | 154,879,127 | 126,382,494 | 50,507,442 |
| 1999 | 1,038,225,823 | 1,252,735,000 | 150,565,377 | 123,047,320 | 48,912,971 |
| 1998 | 1,018,665,080 | 1,241,935,000 | 146,522,356 | 119,846,254 | 47,297,600 |
| 1997 | 999,133,762 | 1,230,075,000 | 142,531,804 | 116,754,792 | 46,029,902 |
| 1996 | 979,678,458 | 1,217,550,000 | 138,557,092 | 113,754,779 | 45,296,124 |
| 1995 | 960,301,044 | 1,204,855,000 | 134,582,253 | 110,819,428 | 44,433,704 |
| 1994 | 941,163,767 | 1,191,835,000 | 130,748,083 | 107,935,714 | 42,626,876 |
| 1993 | 922,118,387 | 1,178,440,000 | 127,020,117 | 105,122,069 | 40,656,336 |
| 1992 | 902,957,070 | 1,164,970,000 | 123,546,848 | 102,372,770 | 39,228,910 |
| 1991 | 883,927,600 | 1,150,780,000 | 120,060,406 | 99,720,162 | 37,925,817 |
| 1990 | 864,972,221 | 1,135,185,000 | 116,155,576 | 97,120,925 | 36,684,063 |
| 1989 | 846,039,529 | 1,118,650,000 | 112,336,629 | 94,531,014 | 35,486,866 |
| 1988 | 827,342,990 | 1,101,630,000 | 108,724,739 | 92,020,090 | 34,382,752 |
| 1987 | 808,931,270 | 1,084,035,000 | 105,130,717 | 89,591,716 | 33,298,904 |
| 1986 | 790,689,978 | 1,066,790,000 | 101,606,764 | 87,235,953 | 32,265,196 |
| 1985 | 772,647,793 | 1,051,040,000 | 98,229,285 | 84,897,973 | 31,264,816 |
| 1984 | 754,875,449 | 1,036,825,000 | 95,164,936 | 82,526,443 | 30,245,081 |
| 1983 | 737,372,681 | 1,023,310,000 | 92,227,711 | 80,438,260 | 29,250,963 |
| 1982 | 720,313,473 | 1,008,630,000 | 89,089,246 | 78,378,701 | 28,338,190 |
| 1981 | 703,696,250 | 993,885,000 | 85,802,049 | 76,068,103 | 27,500,515 |
| 1980 | 687,354,025 | 981,235,000 | 82,291,010 | 73,764,641 | 26,711,099 |
| 1979 | 671,155,747 | 969,005,000 | 78,997,039 | 71,498,242 | 25,886,782 |
| 1978 | 655,728,229 | 956,165,000 | 76,307,379 | 69,326,532 | 24,992,689 |
| 1977 | 640,801,103 | 943,455,000 | 73,901,827 | 67,234,590 | 24,229,061 |
| 1976 | 625,861,883 | 930,685,000 | 71,620,254 | 65,258,009 | 23,624,031 |
| 1975 | 611,309,535 | 916,395,000 | 69,461,175 | 63,410,815 | 23,021,101 |
| 1974 | 597,041,391 | 900,350,000 | 67,415,487 | 61,679,144 | 22,418,878 |
| 1973 | 583,465,598 | 881,940,000 | 65,461,912 | 60,082,139 | 21,827,665 |
| 1972 | 570,482,142 | 862,030,000 | 63,583,194 | 58,601,748 | 21,251,160 |
| 1971 | 558,096,387 | 841,105,000 | 61,847,899 | 57,214,684 | 20,695,569 |
| 1970 | 545,864,268 | 818,315,000 | 60,166,719 | 55,893,838 | 20,137,436 |
| 1969 | 533,880,544 | 796,025,000 | 58,460,939 | 54,631,914 | 19,570,445 |
| 1968 | 522,716,889 | 774,510,000 | 56,810,507 | 53,432,783 | 19,012,189 |
| 1967 | 511,606,372 | 754,550,000 | 55,214,768 | 52,293,065 | 18,462,782 |
| 1966 | 500,740,247 | 735,400,000 | 53,678,667 | 51,188,234 | 17,931,929 |
| 1965 | 490,140,146 | 715,185,000 | 52,209,010 | 50,086,764 | 17,427,802 |
| 1964 | 479,229,598 | 698,355,000 | 50,799,999 | 49,012,016 | 16,955,327 |
| 1963 | 468,138,575 | 682,335,000 | 49,447,776 | 47,973,575 | 16,507,599 |
| 1962 | 457,283,090 | 665,770,000 | 48,156,128 | 46,965,292 | 16,075,724 |
| 1961 | 446,564,729 | 660,330,000 | 46,921,277 | 45,989,310 | 15,662,374 |
| 1960 | 435,990,338 | 667,070,000 | 45,709,310 | 45,053,782 | 15,264,846 |
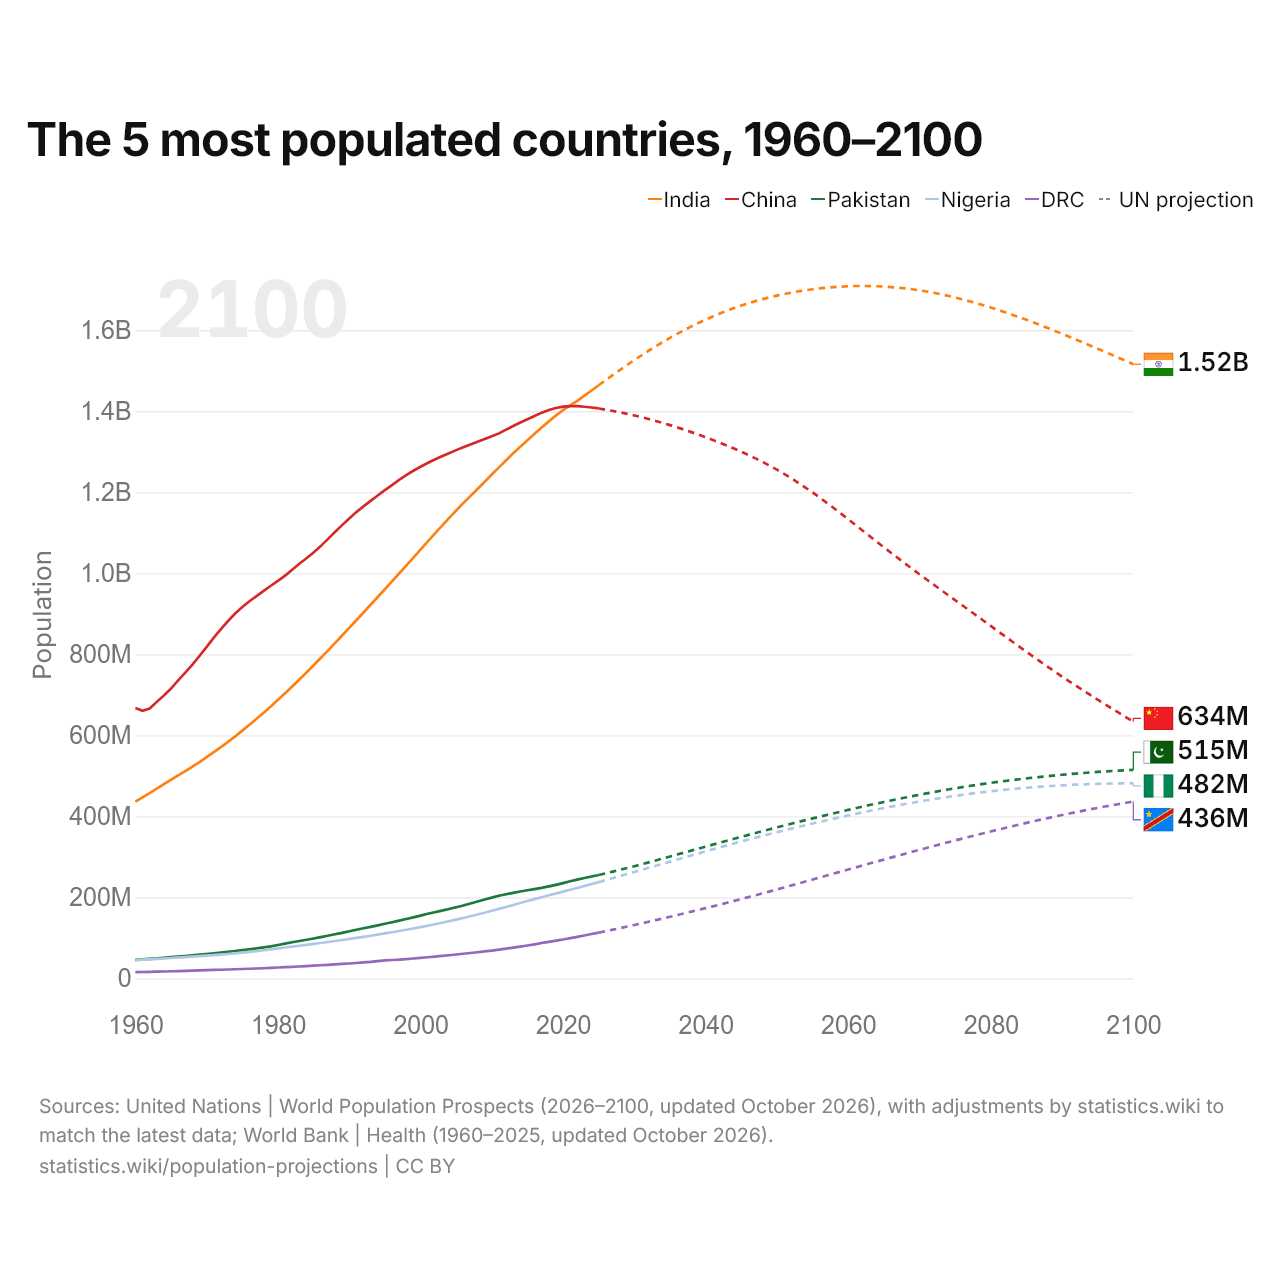
By the UN's projections, the five most populous countries in 2100 will be India (1.52 billion), China (634 million), Pakistan (515 million), Nigeria (482 million) and the DR Congo (436 million). The last change in their order came in 2021, when India's population passed China's.
Compare the population projections of any 2 countries
Sources:
- United Nations | World Population Prospects (2026–2100, updated October 2026), with adjustments by statistics.wiki to match the latest data
- World Bank | Health (1960–2025, updated October 2026)
- U.S. Census Bureau (1960–2025, updated October 2026)
- National Statistics, Taiwan (1960–2026, updated October 2026)
- Central Intelligence Agency (CIA) (1960–2025, updated October 2026)
Creative Commons Attribution (CC BY): you may copy, share, adapt and reuse this content, also commercially, as long as you credit statistics.wiki and note any changes you made. The sources listed above may have their own license terms.