
Saint Vincent population growth per year: natural change (births minus deaths) and net migration
| Year | People per year | ||
|---|---|---|---|
| Population growth | Natural change | Net migration | |
| 2024 | - | 42 | - |
| 2023 | −718 | 66 | −784 |
| 2022 | −730 | 96 | −826 |
| 2021 | −860 | −9 | −851 |
| 2020 | −503 | −10 | −493 |
| 2019 | −776 | 206 | −982 |
| 2018 | −755 | 271 | −1,026 |
| 2017 | −717 | 340 | −1,057 |
| 2016 | −646 | 443 | −1,089 |
| 2015 | −582 | 542 | −1,124 |
| 2014 | −581 | 580 | −1,161 |
| 2013 | −610 | 580 | −1,190 |
| 2012 | −584 | 637 | −1,221 |
| 2011 | −643 | 676 | −1,319 |
| 2010 | −575 | 796 | −1,371 |
| 2009 | −526 | 881 | −1,407 |
| 2008 | −510 | 904 | −1,414 |
| 2007 | −496 | 867 | −1,363 |
| 2006 | −465 | 881 | −1,346 |
| 2005 | −416 | 949 | −1,365 |
| 2004 | −357 | 992 | −1,349 |
| 2003 | −252 | 1,063 | −1,315 |
| 2002 | −167 | 1,166 | −1,333 |
| 2001 | −144 | 1,231 | −1,375 |
| 2000 | 66 | 1,279 | −1,213 |
| 1999 | 296 | 1,315 | −1,019 |
| 1998 | 71 | 1,379 | −1,308 |
| 1997 | 9 | 1,496 | −1,487 |
| 1996 | 35 | 1,610 | −1,575 |
| 1995 | 107 | 1,715 | −1,608 |
| 1994 | 155 | 1,786 | −1,631 |
| 1993 | 203 | 1,832 | −1,629 |
| 1992 | 247 | 1,849 | −1,602 |
| 1991 | 339 | 1,821 | −1,482 |
| 1990 | 475 | 1,825 | −1,350 |
| 1989 | 599 | 1,843 | −1,244 |
| 1988 | 633 | 1,876 | −1,243 |
| 1987 | 686 | 1,937 | −1,251 |
| 1986 | 741 | 2,020 | −1,279 |
| 1985 | 804 | 2,128 | −1,324 |
| 1984 | 843 | 2,248 | −1,405 |
| 1983 | 862 | 2,411 | −1,549 |
| 1982 | 880 | 2,477 | −1,597 |
| 1981 | 903 | 2,429 | −1,526 |
| 1980 | 817 | 2,362 | −1,545 |
| 1979 | 650 | 2,575 | −1,925 |
| 1978 | 749 | 2,581 | −1,832 |
| 1977 | 801 | 2,622 | −1,821 |
| 1976 | 803 | 2,694 | −1,891 |
| 1975 | 817 | 2,775 | −1,958 |
| 1974 | 850 | 2,863 | −2,013 |
| 1973 | 884 | 2,952 | −2,068 |
| 1972 | 917 | 3,033 | −2,116 |
| 1971 | 919 | 3,102 | −2,183 |
| 1970 | 901 | 3,161 | −2,260 |
| 1969 | 908 | 3,200 | −2,292 |
| 1968 | 960 | 3,218 | −2,258 |
| 1967 | 1,034 | 3,212 | −2,178 |
| 1966 | 1,104 | 3,194 | −2,090 |
| 1965 | 1,156 | 3,165 | −2,009 |
| 1964 | 1,199 | 3,130 | −1,931 |
| 1963 | 1,253 | 3,086 | −1,833 |
| 1962 | 1,324 | 3,073 | −1,749 |
| 1961 | 1,412 | 3,059 | −1,647 |
| 1960 | 1,553 | 3,029 | −1,476 |
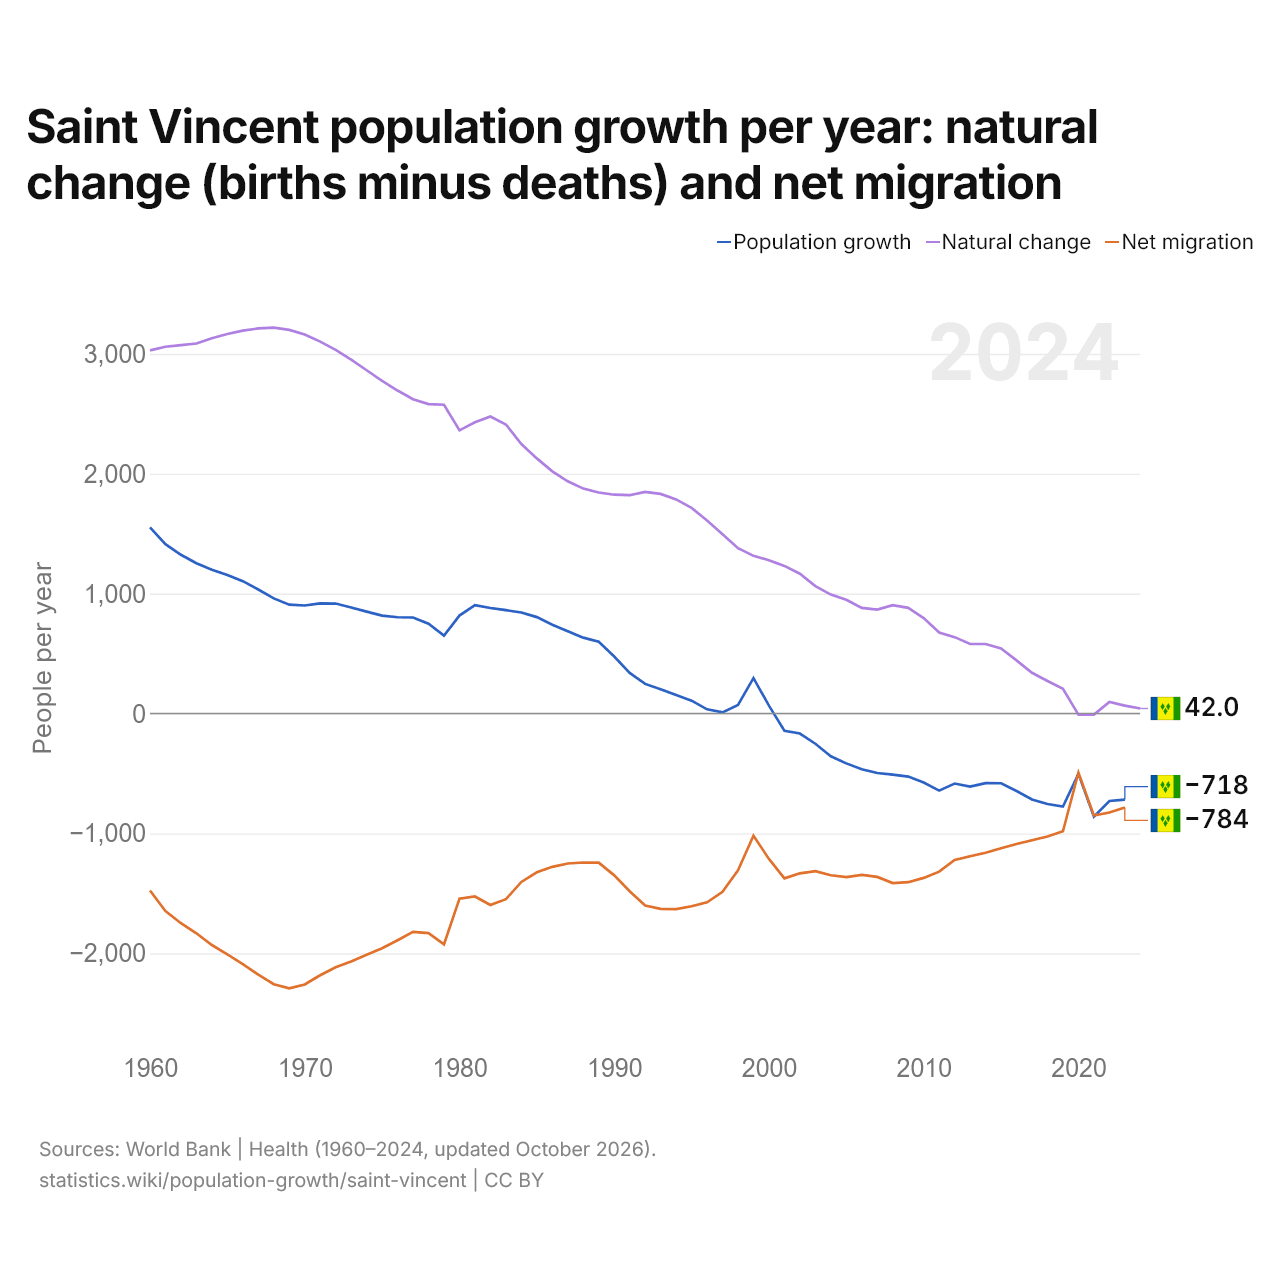
Saint Vincent's population falls by 718 people a year (2023): births outnumber deaths by 66, and 784 more people leave than move in. More people have left Saint Vincent than moved in every year since 1960.
Since 1960, births in Saint Vincent have outnumbered deaths by 113,510 in total, and 96,158 more people have left than moved in. In the ten years from 2014, births outnumbered deaths in Saint Vincent by 2,525, and 9,393 more people left than moved in.
Saint Vincent population growth rate, 1961–2026
| Year | Growth rate |
|---|---|
| Saint Vincent | |
| 2026 projected | −0.68% |
| 2025 | −0.69% |
| 2024 | −0.7% |
| 2023 | −0.71% |
| 2022 | −0.77% |
| 2021 | −0.66% |
| 2020 | −0.62% |
| 2019 | −0.72% |
| 2018 | −0.7% |
| 2017 | −0.65% |
| 2016 | −0.57% |
| 2015 | −0.53% |
| 2014 | −0.55% |
| 2013 | −0.55% |
| 2012 | −0.56% |
| 2011 | −0.55% |
| 2010 | −0.5% |
| 2009 | −0.47% |
| 2008 | −0.45% |
| 2007 | −0.43% |
| 2006 | −0.39% |
| 2005 | −0.34% |
| 2004 | −0.27% |
| 2003 | −0.18% |
| 2002 | −0.14% |
| 2001 | −0.04% |
| 2000 | 0.16% |
| 1999 | 0.16% |
| 1998 | 0.03% |
| 1997 | 0.02% |
| 1996 | 0.06% |
| 1995 | 0.11% |
| 1994 | 0.16% |
| 1993 | 0.2% |
| 1992 | 0.26% |
| 1991 | 0.37% |
| 1990 | 0.49% |
| 1989 | 0.55% |
| 1988 | 0.6% |
| 1987 | 0.66% |
| 1986 | 0.71% |
| 1985 | 0.76% |
| 1984 | 0.79% |
| 1983 | 0.82% |
| 1982 | 0.85% |
| 1981 | 0.83% |
| 1980 | 0.71% |
| 1979 | 0.68% |
| 1978 | 0.76% |
| 1977 | 0.79% |
| 1976 | 0.81% |
| 1975 | 0.83% |
| 1974 | 0.88% |
| 1973 | 0.92% |
| 1972 | 0.95% |
| 1971 | 0.95% |
| 1970 | 0.95% |
| 1969 | 0.99% |
| 1968 | 1.07% |
| 1967 | 1.16% |
| 1966 | 1.24% |
| 1965 | 1.31% |
| 1964 | 1.38% |
| 1963 | 1.48% |
| 1962 | 1.59% |
| 1961 | 1.76% |
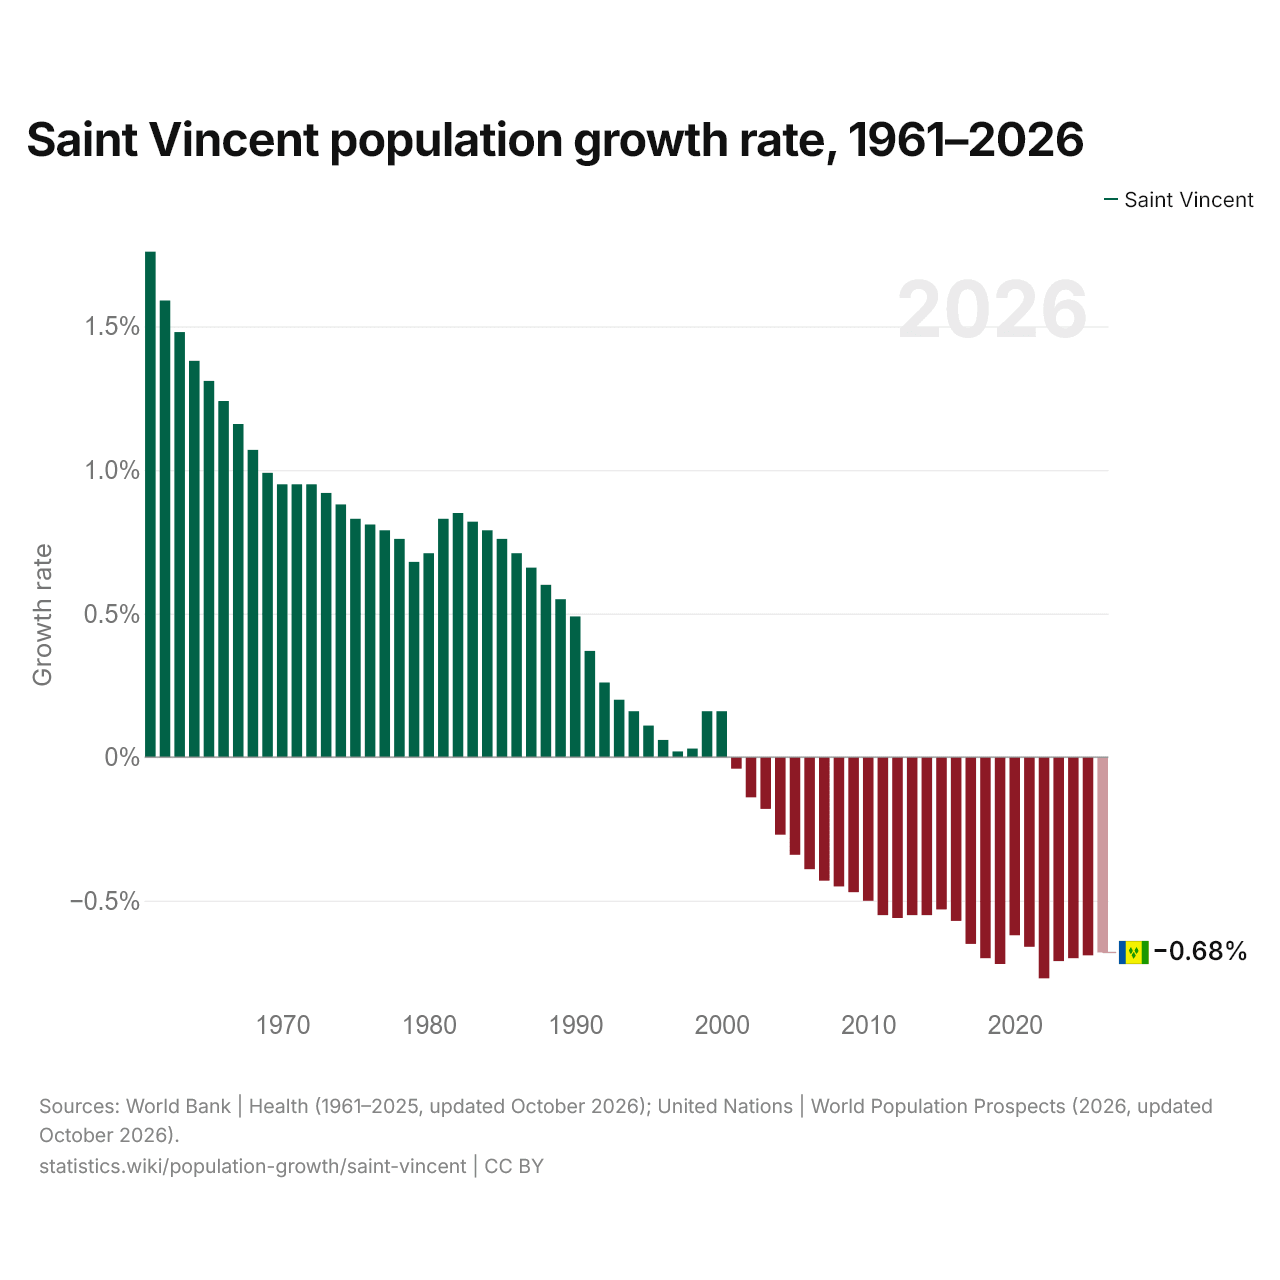
Saint Vincent's population falls by 0.7% in 2026. It has fallen every year since 2001. Growth in Saint Vincent was highest in 1961, at 1.8%; the largest fall was 0.8%, in 2022.
Saint Vincent's population growth in 2026 is the lowest of the 35 countries of Latin America, behind Dominica's fall of 0.6%.
Saint Vincent population growth, 2026
| Growth rate | −0.68% |
|---|---|
| Population change | −681 |
| Average yearly growth, 2021–2026 | −0.71% |
| Average yearly growth, 2016–2026 | −0.69% |
| World rank | 179/197 |
| Halving time at the 2016–2026 rate | 100 years |
Compare Saint Vincent population growth with other countries
Sources:
- World Bank | Health (1960–2025, updated October 2026)
- United Nations | World Population Prospects (2026, updated October 2026)
Creative Commons Attribution (CC BY): you may copy, share, adapt and reuse this content, also commercially, as long as you credit statistics.wiki and note any changes you made. The sources listed above may have their own license terms.