
List of countries by net migration, in people and per 1,000 people
| Rank | Country | People | Per 1,000 people |
|---|---|---|---|
| 1 |  United States |
+1,322,668 | +3.9 |
| 2 |  Syria |
+757,309 | +32.1 |
| 3 |  Germany |
+609,553 | +7.3 |
| 4 |  Chad |
+496,830 | +25.7 |
| 5 |  South Sudan |
+455,000 | +39.6 |
| 6 |  United Kingdom |
+445,523 | +6.5 |
| 7 |  Canada |
+433,842 | +10.8 |
| 8 |  Saudi Arabia |
+325,691 | +9.7 |
| 9 |  Egypt |
+305,006 | +2.7 |
| 10 |  UAE |
+300,004 | +28.6 |
| 11 |  Iran |
+262,044 | +2.9 |
| 12 |  South Africa |
+228,222 | +3.6 |
| 13 |  Taiwan |
+225,599 | +9.7 |
| 14 |  Malaysia |
+181,071 | +5.2 |
| 15 |  Japan |
+175,003 | +1.4 |
| 16 |  Oman |
+156,285 | +31.0 |
| 17 |  Colombia |
+154,521 | +3.0 |
| 18 |  Italy |
+150,189 | +2.5 |
| 19 |  Netherlands |
+144,558 | +8.1 |
| 20 |  Australia |
+140,232 | +5.3 |
| 21 |  Spain |
+119,099 | +2.5 |
| 22 |  France |
+91,862 | +1.3 |
| 23 |  South Korea |
+87,800 | +1.7 |
| 24 |  Armenia |
+75,000 | +25.3 |
| 25 |  Chile |
+62,679 | +3.2 |
| 26 |  Sweden |
+55,209 | +5.2 |
| 27 |  Norway |
+53,806 | +9.7 |
| 28 |  Kuwait |
+50,008 | +10.3 |
| 29 |  Hungary |
+49,213 | +5.1 |
| 30 |  Somalia |
+46,217 | +2.5 |
| 31 |  Switzerland |
+45,098 | +5.1 |
| 32 |  Lithuania |
+44,935 | +15.6 |
| 33 |  Ireland |
+43,873 | +8.3 |
| 34 |  Belgium |
+41,679 | +3.5 |
| 35 |  Qatar |
+39,995 | +15.1 |
| 36 |  Finland |
+38,156 | +6.8 |
| 37 |  Denmark |
+31,006 | +5.2 |
| 38 |  Portugal |
+29,102 | +2.8 |
| 39 |  Russia |
+27,807 | +0.2 |
| 40 |  Singapore |
+26,996 | +4.6 |
| 41 |  Peru |
+24,783 | +0.7 |
| 42 |  New Zealand |
+21,404 | +4.1 |
| 43 |  Bahrain |
+20,002 | +12.7 |
| 44 |  Thailand |
+19,648 | +0.3 |
| 45 |  Turkmenistan |
+15,005 | +2.0 |
| 46 |  Montenegro |
+12,000 | +19.2 |
| 47 |  Namibia |
+11,675 | +3.9 |
| 48 |  Croatia |
+10,202 | +2.6 |
| 49 |  Israel |
+9,999 | +1.0 |
| 50 |  Zambia |
+9,521 | +0.5 |
| 51 |  Cyprus |
+8,697 | +6.5 |
| 52 |  Latvia |
+7,966 | +4.2 |
| 53 |  Panama |
+7,262 | +1.6 |
| 54 |  Malta |
+6,591 | +11.9 |
| 55 |  Ivory Coast |
+6,002 | +0.2 |
| 56 |  Luxembourg |
+5,905 | +8.9 |
| 57 |  Estonia |
+5,717 | +4.2 |
| 58 |  Kyrgyzstan |
+5,601 | +0.8 |
| 59 |  Slovenia |
+5,339 | +2.5 |
| 60 |  Bulgaria |
+5,173 | +0.8 |
| 61 |  Slovakia |
+4,933 | +0.9 |
| 62 |  Austria |
+4,819 | +0.5 |
| 63 |  Iceland |
+4,630 | +12.0 |
| 64 |  Serbia |
+4,348 | +0.7 |
| 65 |  Argentina |
+4,133 | +0.1 |
| 66 |  Equatorial Guinea |
+3,997 | +2.2 |
| 67 |  Mauritania |
+2,999 | +0.6 |
| 68 |  Trinidad |
+2,126 | +1.6 |
| 69 |  Georgia |
+2,003 | +0.5 |
| 70 |  Burundi |
+1,995 | +0.1 |
| 71 |  Seychelles |
+1,809 | +15.1 |
| 72 |  Solomon Islands |
+1,636 | +2.0 |
| 73 |  Andorra |
+1,061 | +13.1 |
| 74 |  Bahamas |
+1,001 | +2.5 |
| 75 |  Costa Rica |
+995 | +0.2 |
| 75 |  Niger |
+995 | +0.0 |
| 77 |  Gabon |
+987 | +0.4 |
| 78 |  Cayman Islands |
+921 | +12.6 |
| 79 |  Belize |
+595 | +1.4 |
| 80 |  Curacao |
+518 | +3.3 |
| 81 |  Djibouti |
+500 | +0.4 |
| 82 |  Bhutan |
+291 | +0.4 |
| 83 |  Liechtenstein |
+214 | +5.4 |
| 84 |  Monaco |
+88 | +2.3 |
| 85 |  Antigua |
+0 | +0.0 |
| 85 |  Brunei |
+0 | +0.0 |
| 85 |  Mongolia |
+0 | +0.0 |
| 85 |  Saint Kitts |
+0 | +0.0 |
| 85 |  Saint Lucia |
+0 | +0.0 |
| 85 |  Vanuatu |
+0 | +0.0 |
| 91 |  Palau |
−19 | −1.1 |
| 92 |  Barbados |
−80 | −0.3 |
| 93 |  Nauru |
−148 | −12.5 |
| 94 |  Grenada |
−190 | −1.6 |
| 94 |  San Marino |
−190 | −5.6 |
| 96 |  Benin |
−192 | +0.0 |
| 97 |  Dominica |
−199 | −3.0 |
| 98 |  Tuvalu |
−323 | −32.9 |
| 99 |  Bosnia |
−485 | −0.2 |
| 99 |  Kiribati |
−485 | −3.7 |
| 101 |  Sao Tome |
−592 | −2.6 |
| 102 |  Saint Vincent |
−784 | −7.7 |
| 103 |  Papua New Guinea |
−787 | −0.1 |
| 104 |  Suriname |
−988 | −1.6 |
| 105 |  Angola |
−995 | +0.0 |
| 105 |  Congo |
−995 | −0.2 |
| 107 |  Cape Verde |
−1,226 | −2.3 |
| 108 |  Guinea-Bissau |
−1,400 | −0.7 |
| 109 |  Madagascar |
−1,487 | +0.0 |
| 110 |  Uruguay |
−1,501 | −0.4 |
| 111 |  Marshall Islands |
−1,832 | −47.2 |
| 112 |  North Korea |
−1,997 | −0.1 |
| 113 |  Libya |
−2,001 | −0.3 |
| 114 |  Comoros |
−2,002 | −2.4 |
| 115 |  Tonga |
−2,173 | −20.8 |
| 116 |  Samoa |
−2,810 | −13.0 |
| 117 |  Mauritius |
−2,824 | −2.3 |
| 118 |  Maldives |
−2,877 | −5.5 |
| 119 |  Gambia |
−3,000 | −1.1 |
| 120 |  Bolivia |
−3,008 | −0.2 |
| 121 |  Belarus |
−3,034 | −0.3 |
| 122 |  Fiji |
−3,289 | −3.6 |
| 123 |  Guinea |
−3,997 | −0.3 |
| 124 |  Sierra Leone |
−4,000 | −0.5 |
| 125 |  Cameroon |
−4,798 | −0.2 |
| 126 |  Kazakhstan |
−4,822 | −0.2 |
| 127 |  Liberia |
−5,002 | −0.9 |
| 128 |  Honduras |
−5,044 | −0.5 |
| 129 |  Lesotho |
−5,168 | −2.2 |
| 130 |  Yemen |
−5,233 | −0.1 |
| 131 |  North Macedonia |
−5,597 | −3.1 |
| 132 |  East Timor |
−5,620 | −4.1 |
| 133 |  Iraq |
−5,710 | −0.1 |
| 134 |  Malawi |
−5,811 | −0.3 |
| 135 |  Uzbekistan |
−6,004 | −0.2 |
| 136 |  Guyana |
−6,161 | −7.5 |
| 137 |  Botswana |
−6,487 | −2.6 |
| 138 |  Poland |
−7,824 | −0.2 |
| 139 |  Nicaragua |
−7,996 | −1.2 |
| 140 |  Eswatini |
−8,549 | −6.9 |
| 141 |  Guatemala |
−8,940 | −0.5 |
| 142 |  Rwanda |
−9,001 | −0.6 |
| 143 |  Senegal |
−9,999 | −0.6 |
| 144 |  Ghana |
−10,003 | −0.3 |
| 144 |  Jamaica |
−10,003 | −3.5 |
| 144 |  Kenya |
−10,003 | −0.2 |
| 144 |  Laos |
−10,003 | −1.3 |
| 148 |  Ethiopia |
−11,996 | −0.1 |
| 149 |  Paraguay |
−12,500 | −1.8 |
| 150 |  Tunisia |
−14,001 | −1.1 |
| 151 |  Czech Republic |
−14,638 | −1.3 |
| 152 |  CAR |
−14,682 | −2.8 |
| 153 |  DR Congo |
−14,992 | −0.1 |
| 154 |  Eritrea |
−15,284 | −4.4 |
| 155 |  Togo |
−15,406 | −1.9 |
| 156 |  Jordan |
−17,445 | −1.5 |
| 157 |  Moldova |
−18,570 | −7.6 |
| 158 |  Tajikistan |
−19,999 | −1.9 |
| 159 |  Ecuador |
−21,948 | −1.2 |
| 160 |  Cuba |
−22,797 | −2.1 |
| 161 |  El Salvador |
−23,253 | −3.7 |
| 162 |  Burkina Faso |
−24,957 | −1.1 |
| 163 |  Palestine |
−24,996 | −4.8 |
| 164 |  Albania |
−25,357 | −10.5 |
| 165 |  Algeria |
−25,963 | −0.6 |
| 166 |  Romania |
−27,780 | −1.5 |
| 167 |  Sri Lanka |
−28,011 | −1.3 |
| 168 |  Haiti |
−31,786 | −2.7 |
| 169 |  Cambodia |
−31,837 | −1.8 |
| 170 |  Lebanon |
−34,193 | −5.9 |
| 171 |  Dominican Republic |
−34,915 | −3.1 |
| 172 |  Myanmar |
−34,989 | −0.6 |
| 173 |  Mozambique |
−36,276 | −1.1 |
| 174 |  Indonesia |
−37,501 | −0.1 |
| 175 |  Tanzania |
−39,388 | −0.6 |
| 176 |  Morocco |
−39,650 | −1.1 |
| 177 |  Mali |
−39,953 | −1.7 |
| 178 |  Afghanistan |
−48,958 | −1.2 |
| 179 |  Nigeria |
−57,936 | −0.3 |
| 180 |  Vietnam |
−81,789 | −0.8 |
| 181 |  Azerbaijan |
−84,122 | −8.3 |
| 182 |  Zimbabwe |
−97,380 | −6.0 |
| 183 |  Mexico |
−101,044 | −0.8 |
| 184 |  Venezuela |
−112,899 | −4.0 |
| 185 |  Uganda |
−126,181 | −2.6 |
| 186 |  Greece |
−159,430 | −15.3 |
| 187 |  Philippines |
−164,284 | −1.4 |
| 188 |  Brazil |
−240,059 | −1.1 |
| 189 |  Ukraine |
−299,961 | −7.9 |
| 190 |  Turkey |
−318,070 | −3.7 |
| 191 |  Nepal |
−409,782 | −13.8 |
| 192 |  Bangladesh |
−549,918 | −3.2 |
| 193 |  China |
−567,724 | −0.4 |
| 194 |  India |
−979,179 | −0.7 |
| 195 |  Sudan |
−1,349,998 | −27.0 |
| 196 |  Pakistan |
−1,619,557 | −6.5 |
The largest net gain from migration is in the United States, 1.32 million more people moving in than leaving, and the largest net loss in Pakistan, 1.62 million more leaving than moving in. More people move in than leave in 84 of the 196 countries; in 106, more leave than move in.
Net migration is the number of people who move to a country minus the number who leave it in a year, whatever their citizenship. The net migration rate is that number per 1,000 people of the population. The figures are the United Nations' estimates (World Population Prospects).
Net migration per 1,000 people by country
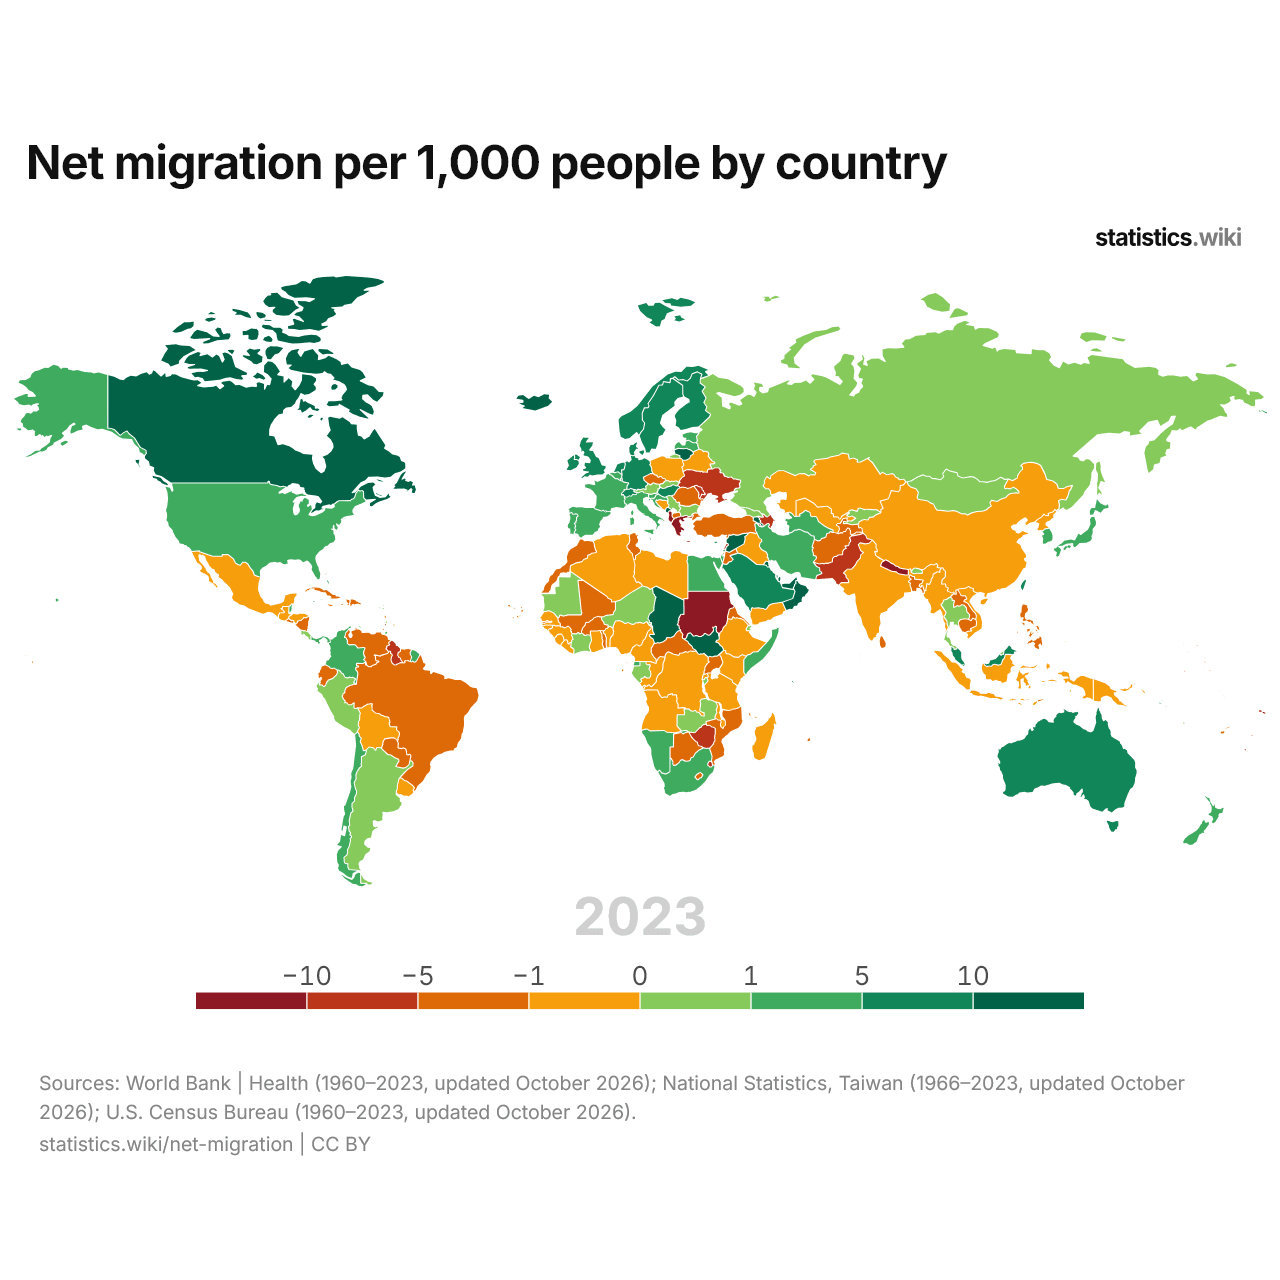
Through migration, 34 countries gain more than 5 people per 1,000 and 20 lose more than 5; in 1960, the numbers were 28 and 41.
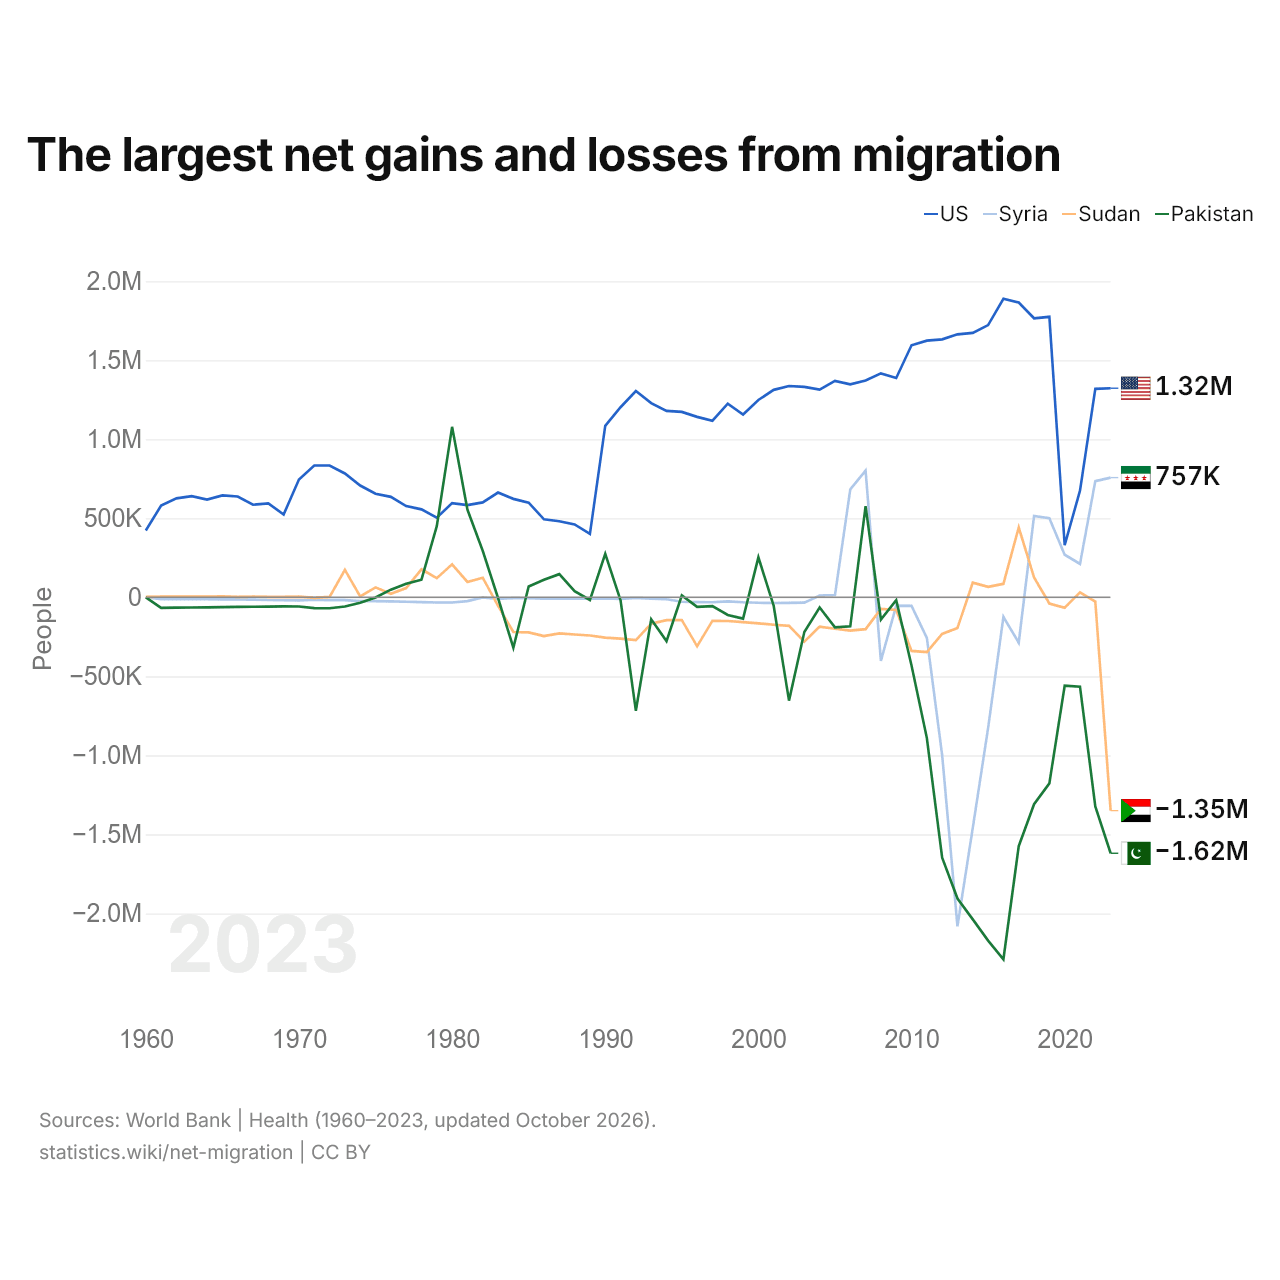
The largest net gains and losses from migration
| Year | People | |||
|---|---|---|---|---|
| United States | Syria | Sudan | Pakistan | |
| 2023 | 1,322,668 | 757,309 | −1,349,998 | −1,619,557 |
| 2022 | 1,319,009 | 735,142 | −26,668 | −1,322,625 |
| 2021 | 674,787 | 211,220 | 31,664 | −565,673 |
| 2020 | 329,769 | 269,050 | −65,933 | −559,291 |
| 2019 | 1,774,500 | 500,985 | −39,491 | −1,177,220 |
| 2018 | 1,764,961 | 514,102 | 125,499 | −1,309,611 |
| 2017 | 1,864,738 | −287,501 | 441,623 | −1,574,585 |
| 2016 | 1,889,129 | −124,063 | 84,728 | −2,290,411 |
| 2015 | 1,722,127 | −827,496 | 66,476 | −2,172,162 |
| 2014 | 1,672,598 | −1,457,679 | 92,504 | −2,037,920 |
| 2013 | 1,663,885 | −2,081,303 | −194,001 | −1,906,319 |
| 2012 | 1,632,007 | −999,267 | −232,196 | −1,647,989 |
| 2011 | 1,624,033 | −256,888 | −347,024 | −890,633 |
| 2010 | 1,594,453 | −54,359 | −339,466 | −431,902 |
| 2009 | 1,387,306 | −52,703 | −80,159 | −18,298 |
| 2008 | 1,416,841 | −402,393 | −73,188 | −140,746 |
| 2007 | 1,371,353 | 801,514 | −201,769 | 576,349 |
| 2006 | 1,347,750 | 682,911 | −211,387 | −183,933 |
| 2005 | 1,369,224 | 13,382 | −199,378 | −189,899 |
| 2004 | 1,313,467 | 10,881 | −185,392 | −64,669 |
| 2003 | 1,331,376 | −33,920 | −281,001 | −219,118 |
| 2002 | 1,336,518 | −35,096 | −180,603 | −653,758 |
| 2001 | 1,312,455 | −36,383 | −173,745 | −54,727 |
| 2000 | 1,248,392 | −34,425 | −165,030 | 252,869 |
| 1999 | 1,156,311 | −31,394 | −157,090 | −134,510 |
| 1998 | 1,225,134 | −26,025 | −150,271 | −112,191 |
| 1997 | 1,116,922 | −31,571 | −148,368 | −55,539 |
| 1996 | 1,141,648 | −30,197 | −310,221 | −60,855 |
| 1995 | 1,173,016 | −28,122 | −144,670 | 11,534 |
| 1994 | 1,179,309 | −12,630 | −144,324 | −277,100 |
| 1993 | 1,228,478 | −8,828 | −166,861 | −139,493 |
| 1992 | 1,304,880 | −4,063 | −271,093 | −718,387 |
| 1991 | 1,202,426 | −10,154 | −261,341 | −19,668 |
| 1990 | 1,084,720 | −6,620 | −254,825 | 275,242 |
| 1989 | 400,998 | −8,379 | −241,979 | −17,164 |
| 1988 | 460,778 | −8,426 | −235,213 | 38,139 |
| 1987 | 480,815 | −8,335 | −228,756 | 146,364 |
| 1986 | 493,082 | −9,485 | −245,968 | 111,045 |
| 1985 | 598,777 | −6,221 | −222,315 | 68,860 |
| 1984 | 622,793 | −5,245 | −219,755 | −319,242 |
| 1983 | 662,840 | −9,729 | −54,325 | −4,753 |
| 1982 | 600,149 | −721 | 124,007 | 294,252 |
| 1981 | 583,070 | −24,536 | 96,697 | 555,032 |
| 1980 | 595,916 | −33,114 | 208,602 | 1,078,229 |
| 1979 | 503,559 | −32,793 | 120,613 | 450,003 |
| 1978 | 556,521 | −30,567 | 177,153 | 111,386 |
| 1977 | 577,060 | −28,275 | 58,540 | 85,250 |
| 1976 | 635,590 | −26,268 | 22,147 | 48,238 |
| 1975 | 655,078 | −24,389 | 62,843 | −1,710 |
| 1974 | 706,978 | −24,242 | 6,023 | −34,785 |
| 1973 | 783,163 | −17,502 | 173,143 | −58,012 |
| 1972 | 833,543 | −17,610 | 2,238 | −69,209 |
| 1971 | 833,549 | −15,167 | −3,577 | −68,357 |
| 1970 | 744,902 | −19,594 | 4,479 | −58,281 |
| 1969 | 523,740 | −18,749 | 2,476 | −57,406 |
| 1968 | 594,514 | −16,968 | 2,776 | −58,721 |
| 1967 | 585,410 | −14,618 | 4,508 | −59,932 |
| 1966 | 637,692 | −13,434 | 2,813 | −61,025 |
| 1965 | 644,902 | −12,704 | 6,367 | −62,070 |
| 1964 | 618,635 | −12,044 | 4,505 | −63,298 |
| 1963 | 639,495 | −11,817 | 4,263 | −64,552 |
| 1962 | 625,617 | −11,641 | 4,387 | −65,780 |
| 1961 | 580,333 | −11,237 | 3,904 | −66,991 |
| 1960 | 422,708 | 0 | 2,194 | 0 |
Net migration among these four countries ranges from a gain of 1.32 million in the United States to a loss of 1.62 million in Pakistan. The United States' net gain has been the largest of the four since 1981.
10 countries with the largest net gain from migration
10 countries with the largest net loss from migration
The ten countries with the largest net gains gain 5.45 million people a year together, and the ten with the largest net losses lose 6.5 million.
Compare the net migration of any 2 countries
Sources:
- World Bank | Health (1960–2023, updated October 2026)
- National Statistics, Taiwan (1966–2023, updated October 2026)
- U.S. Census Bureau (1960–2023, updated October 2026)
Creative Commons Attribution (CC BY): you may copy, share, adapt and reuse this content, also commercially, as long as you credit statistics.wiki and note any changes you made. The sources listed above may have their own license terms.