
Émirats arabes unis vs Arabie saoudite : PIB, 1960–2025
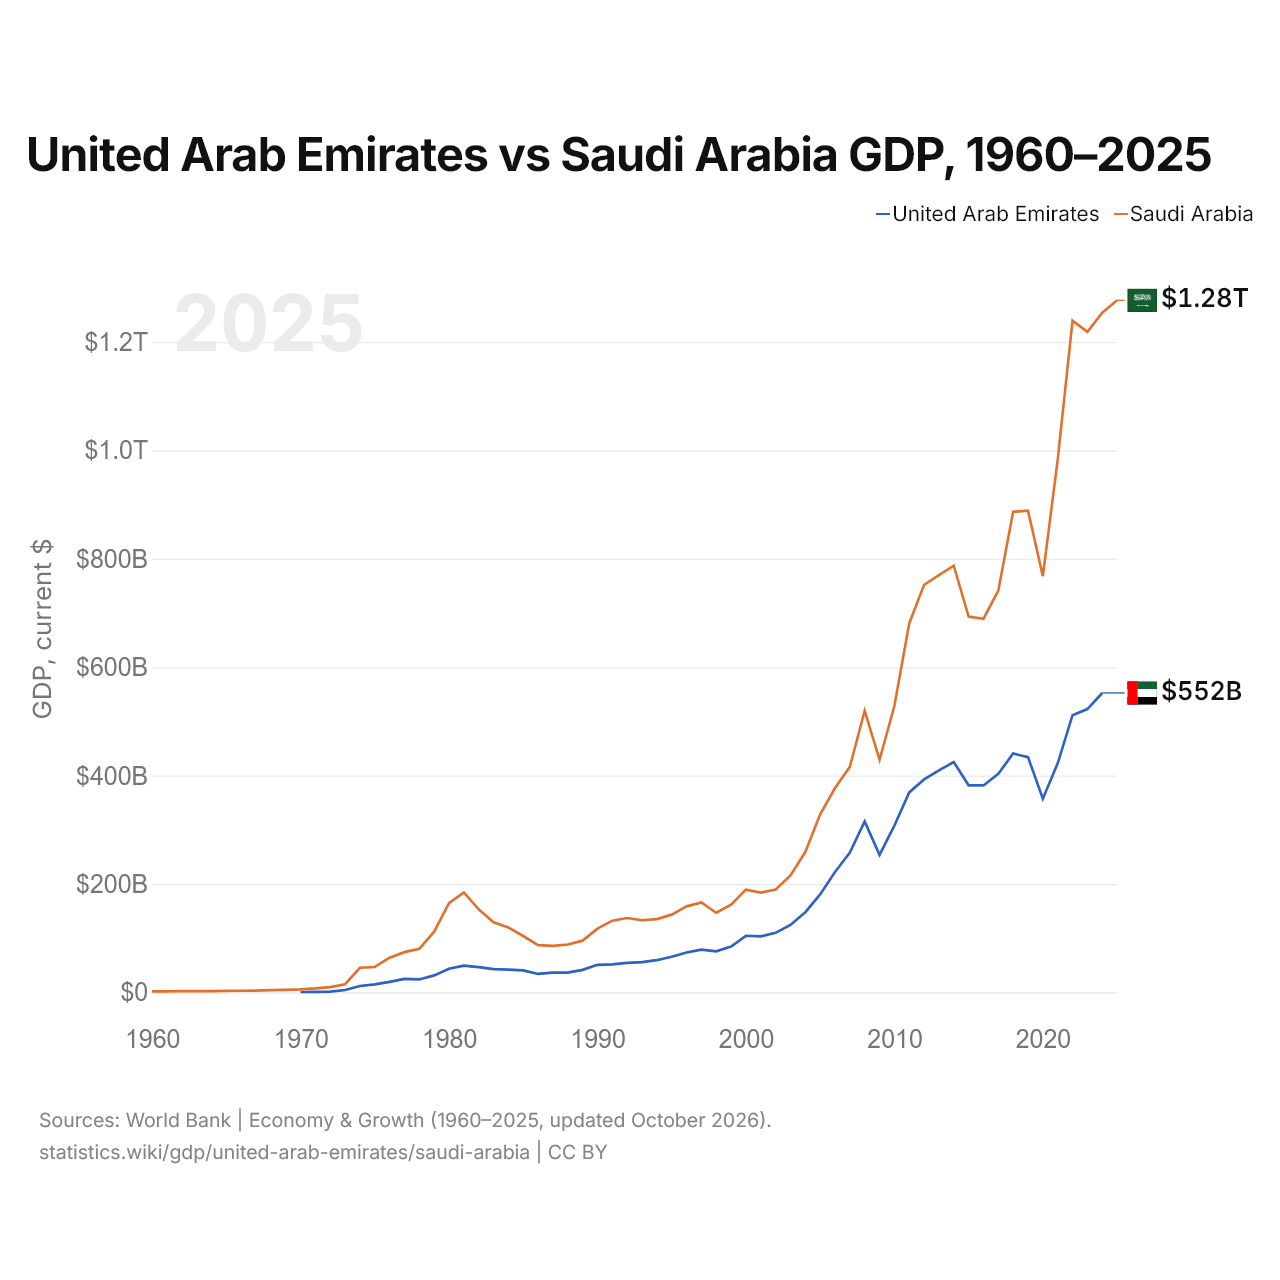
| Année | PIB, dollars US courants | |
|---|---|---|
 EAU |
 Arabie saoudite |
|
| 2025 | - | 1 276 942 933 333 $ US |
| 2024 | 552 324 919 096 $ US | 1 254 140 800 000 $ US |
| 2023 | 522 622 268 401 $ US | 1 218 584 800 000 $ US |
| 2022 | 511 403 404 642 $ US | 1 239 075 200 000 $ US |
| 2021 | 422 441 282 436 $ US | 982 661 066 667 $ US |
| 2020 | 357 161 776 271 $ US | 767 951 200 000 $ US |
| 2019 | 433 926 218 686 $ US | 888 890 133 333 $ US |
| 2018 | 440 560 003 161 $ US | 886 564 800 000 $ US |
| 2017 | 403 365 056 079 $ US | 741 266 133 333 $ US |
| 2016 | 381 717 208 621 $ US | 689 279 466 667 $ US |
| 2015 | 381 973 135 513 $ US | 693 414 400 000 $ US |
| 2014 | 424 935 834 104 $ US | 787 153 066 667 $ US |
| 2013 | 409 632 574 703 $ US | 769 755 733 333 $ US |
| 2012 | 392 793 559 051 $ US | 751 921 333 333 $ US |
| 2011 | 368 881 033 963 $ US | 680 660 800 000 $ US |
| 2010 | 307 736 348 527 $ US | 528 207 466 667 $ US |
| 2009 | 253 547 358 747 $ US | 429 097 866 667 $ US |
| 2008 | 315 474 615 741 $ US | 519 796 800 000 $ US |
| 2007 | 257 916 148 767 $ US | 415 964 509 673 $ US |
| 2006 | 222 116 532 963 $ US | 376 900 133 511 $ US |
| 2005 | 180 617 467 954 $ US | 328 459 608 764 $ US |
| 2004 | 147 824 249 958 $ US | 258 742 133 333 $ US |
| 2003 | 124 346 476 180 $ US | 215 807 733 333 $ US |
| 2002 | 109 816 091 079 $ US | 189 605 866 667 $ US |
| 2001 | 103 311 631 797 $ US | 184 137 600 000 $ US |
| 2000 | 104 337 463 730 $ US | 189 514 933 333 $ US |
| 1999 | 84 445 399 335 $ US | 161 717 066 667 $ US |
| 1998 | 75 674 384 205 $ US | 146 775 466 667 $ US |
| 1997 | 78 838 886 862 $ US | 165 963 684 913 $ US |
| 1996 | 73 571 217 377 $ US | 158 662 483 311 $ US |
| 1995 | 65 743 604 966 $ US | 143 343 124 166 $ US |
| 1994 | 59 305 111 228 $ US | 135 174 899 866 $ US |
| 1993 | 55 625 269 485 $ US | 132 967 957 276 $ US |
| 1992 | 54 239 188 746 $ US | 137 087 850 467 $ US |
| 1991 | 51 552 058 250 $ US | 132 223 230 975 $ US |
| 1990 | 50 701 374 187 $ US | 117 630 173 565 $ US |
| 1989 | 41 464 966 302 $ US | 95 344 459 279 $ US |
| 1988 | 36 275 613 877 $ US | 88 256 074 766 $ US |
| 1987 | 36 384 802 310 $ US | 85 695 861 148 $ US |
| 1986 | 33 943 568 481 $ US | 86 961 922 765 $ US |
| 1985 | 40 603 631 079 $ US | 103 897 846 494 $ US |
| 1984 | 41 807 931 453 $ US | 119 624 858 116 $ US |
| 1983 | 42 803 373 390 $ US | 129 171 635 311 $ US |
| 1982 | 46 622 715 281 $ US | 153 240 313 858 $ US |
| 1981 | 49 333 471 895 $ US | 184 291 360 139 $ US |
| 1980 | 43 599 134 193 $ US | 164 539 660 725 $ US |
| 1979 | 31 225 557 022 $ US | 111 858 444 786 $ US |
| 1978 | 23 775 718 541 $ US | 80 266 516 687 $ US |
| 1977 | 24 871 660 292 $ US | 74 188 986 586 $ US |
| 1976 | 19 213 212 475 $ US | 64 005 665 722 $ US |
| 1975 | 14 720 729 969 $ US | 46 773 208 643 $ US |
| 1974 | 11 651 505 689 $ US | 45 412 957 746 $ US |
| 1973 | 4 231 243 616 $ US | 14 947 435 499 $ US |
| 1972 | 1 415 086 929 $ US | 9 664 267 087 $ US |
| 1971 | 939 893 600 $ US | 7 184 806 909 $ US |
| 1970 | 685 986 701 $ US | 5 377 333 333 $ US |
| 1969 | - | 4 485 777 644 $ US |
| 1968 | - | 4 187 777 711 $ US |
| 1967 | - | 3 257 022 223 $ US |
| 1966 | - | 2 920 555 557 $ US |
| 1965 | - | 2 647 955 558 $ US |
| 1964 | - | 2 371 808 713 $ US |
| 1963 | - | 2 207 393 172 $ US |
| 1962 | - | 2 130 606 532 $ US |
| 1961 | - | 1 920 811 284 $ US |
| 1960 | - | 1 748 124 064 $ US |
Le PIB de l'Arabie saoudite (1,25 billion de dollars US, 2024) était 2,3 fois celui des Émirats arabes unis (552 milliards de dollars US, 2024). En 2014, le rapport était de 1,9. Depuis 2014, à prix constants de 2015, le PIB de l'Arabie saoudite a progressé de 33,8 % et celui des Émirats arabes unis de 28,1 %.
Depuis 1970, le PIB de l'Arabie saoudite a chaque année été le plus élevé des deux ; en 1970, il était 7,8 fois celui des Émirats arabes unis. Le PIB par habitant est de 50 274 $ US aux Émirats arabes unis (2024) et de 34 537 $ US en Arabie saoudite (2025).
Émirats arabes unis vs Arabie saoudite : derniers chiffres du PIB
|
EAU
|
Arabie saoudite
|
|
|---|---|---|
| PIB, dollars US courants | 552 Md $US (2024) | 1,28 Bn $US (2025) |
| Rang mondial | 31/197 | 19/197 |
| Part mondiale | 0,49 % | 1,08 % |
| PIB, dollars US constants de 2015 | 457 Md $US (2024) | 927 Md $US (2025) |
Comparer le PIB de 2 pays au choix
Sources :
- Banque mondiale | Économie et croissance (1960–2025, mis à jour en octobre 2026)
Creative Commons Attribution (CC BY) : vous pouvez copier, partager, adapter et réutiliser ce contenu, y compris à des fins commerciales, à condition de citer statistics.wiki et d’indiquer les modifications apportées. Les sources citées ci-dessus peuvent avoir leurs propres conditions de licence.