
Émirats arabes unis vs Israël : PIB, 1960–2025
| Année | PIB, dollars US courants | |
|---|---|---|
 EAU |
 Israël |
|
| 2025 | - | 610 777 842 874 $ US |
| 2024 | 552 324 919 096 $ US | 542 284 494 491 $ US |
| 2023 | 522 622 268 401 $ US | 513 393 395 492 $ US |
| 2022 | 511 403 404 642 $ US | 525 157 951 213 $ US |
| 2021 | 422 441 282 436 $ US | 489 735 019 666 $ US |
| 2020 | 357 161 776 271 $ US | 410 908 899 711 $ US |
| 2019 | 433 926 218 686 $ US | 399 207 771 082 $ US |
| 2018 | 440 560 003 161 $ US | 375 470 422 244 $ US |
| 2017 | 403 365 056 079 $ US | 357 360 816 857 $ US |
| 2016 | 381 717 208 621 $ US | 321 083 954 798 $ US |
| 2015 | 381 973 135 513 $ US | 302 841 190 258 $ US |
| 2014 | 424 935 834 104 $ US | 314 376 760 832 $ US |
| 2013 | 409 632 574 703 $ US | 298 045 324 736 $ US |
| 2012 | 392 793 559 051 $ US | 263 172 104 091 $ US |
| 2011 | 368 881 033 963 $ US | 267 739 352 609 $ US |
| 2010 | 307 736 348 527 $ US | 239 372 857 534 $ US |
| 2009 | 253 547 358 747 $ US | 213 112 649 594 $ US |
| 2008 | 315 474 615 741 $ US | 220 952 472 408 $ US |
| 2007 | 257 916 148 767 $ US | 184 448 882 452 $ US |
| 2006 | 222 116 532 963 $ US | 158 706 516 002 $ US |
| 2005 | 180 617 467 954 $ US | 147 346 035 831 $ US |
| 2004 | 147 824 249 958 $ US | 139 925 423 025 $ US |
| 2003 | 124 346 476 180 $ US | 131 278 887 815 $ US |
| 2002 | 109 816 091 079 $ US | 125 215 963 105 $ US |
| 2001 | 103 311 631 797 $ US | 134 889 159 474 $ US |
| 2000 | 104 337 463 730 $ US | 136 409 902 632 $ US |
| 1999 | 84 445 399 335 $ US | 121 329 240 042 $ US |
| 1998 | 75 674 384 205 $ US | 120 468 659 246 $ US |
| 1997 | 78 838 886 862 $ US | 119 389 303 067 $ US |
| 1996 | 73 571 217 377 $ US | 115 051 957 577 $ US |
| 1995 | 65 743 604 966 $ US | 105 432 315 611 $ US |
| 1994 | 59 305 111 228 $ US | 90 684 108 118 $ US |
| 1993 | 55 625 269 485 $ US | 79 806 598 120 $ US |
| 1992 | 54 239 188 746 $ US | 79 408 652 426 $ US |
| 1991 | 51 552 058 250 $ US | 70 954 941 681 $ US |
| 1990 | 50 701 374 187 $ US | 61 978 459 022 $ US |
| 1989 | 41 464 966 302 $ US | 52 411 116 588 $ US |
| 1988 | 36 275 613 877 $ US | 52 618 458 014 $ US |
| 1987 | 36 384 802 310 $ US | 43 022 977 765 $ US |
| 1986 | 33 943 568 481 $ US | 35 812 041 620 $ US |
| 1985 | 40 603 631 079 $ US | 28 887 898 639 $ US |
| 1984 | 41 807 931 453 $ US | 30 626 695 891 $ US |
| 1983 | 42 803 373 390 $ US | 32 655 591 256 $ US |
| 1982 | 46 622 715 281 $ US | 29 237 231 967 $ US |
| 1981 | 49 333 471 895 $ US | 26 865 420 933 $ US |
| 1980 | 43 599 134 193 $ US | 25 379 585 067 $ US |
| 1979 | 31 225 557 022 $ US | 22 595 788 591 $ US |
| 1978 | 23 775 718 541 $ US | 17 690 363 444 $ US |
| 1977 | 24 871 660 292 $ US | 18 245 847 441 $ US |
| 1976 | 19 213 212 475 $ US | 15 946 502 888 $ US |
| 1975 | 14 720 729 969 $ US | 16 131 806 290 $ US |
| 1974 | 11 651 505 689 $ US | 17 162 009 924 $ US |
| 1973 | 4 231 243 616 $ US | 11 895 229 181 $ US |
| 1972 | 1 415 086 929 $ US | 9 216 866 299 $ US |
| 1971 | 939 893 600 $ US | 7 048 191 876 $ US |
| 1970 | 685 986 701 $ US | 7 402 142 195 $ US |
| 1969 | - | 6 293 966 357 $ US |
| 1968 | - | 5 455 059 532 $ US |
| 1967 | - | 4 759 447 914 $ US |
| 1966 | - | 4 700 397 692 $ US |
| 1965 | - | 4 326 412 951 $ US |
| 1964 | - | 4 021 861 430 $ US |
| 1963 | - | 3 533 767 055 $ US |
| 1962 | - | 2 964 323 618 $ US |
| 1961 | - | 3 706 297 903 $ US |
| 1960 | - | 3 068 690 949 $ US |
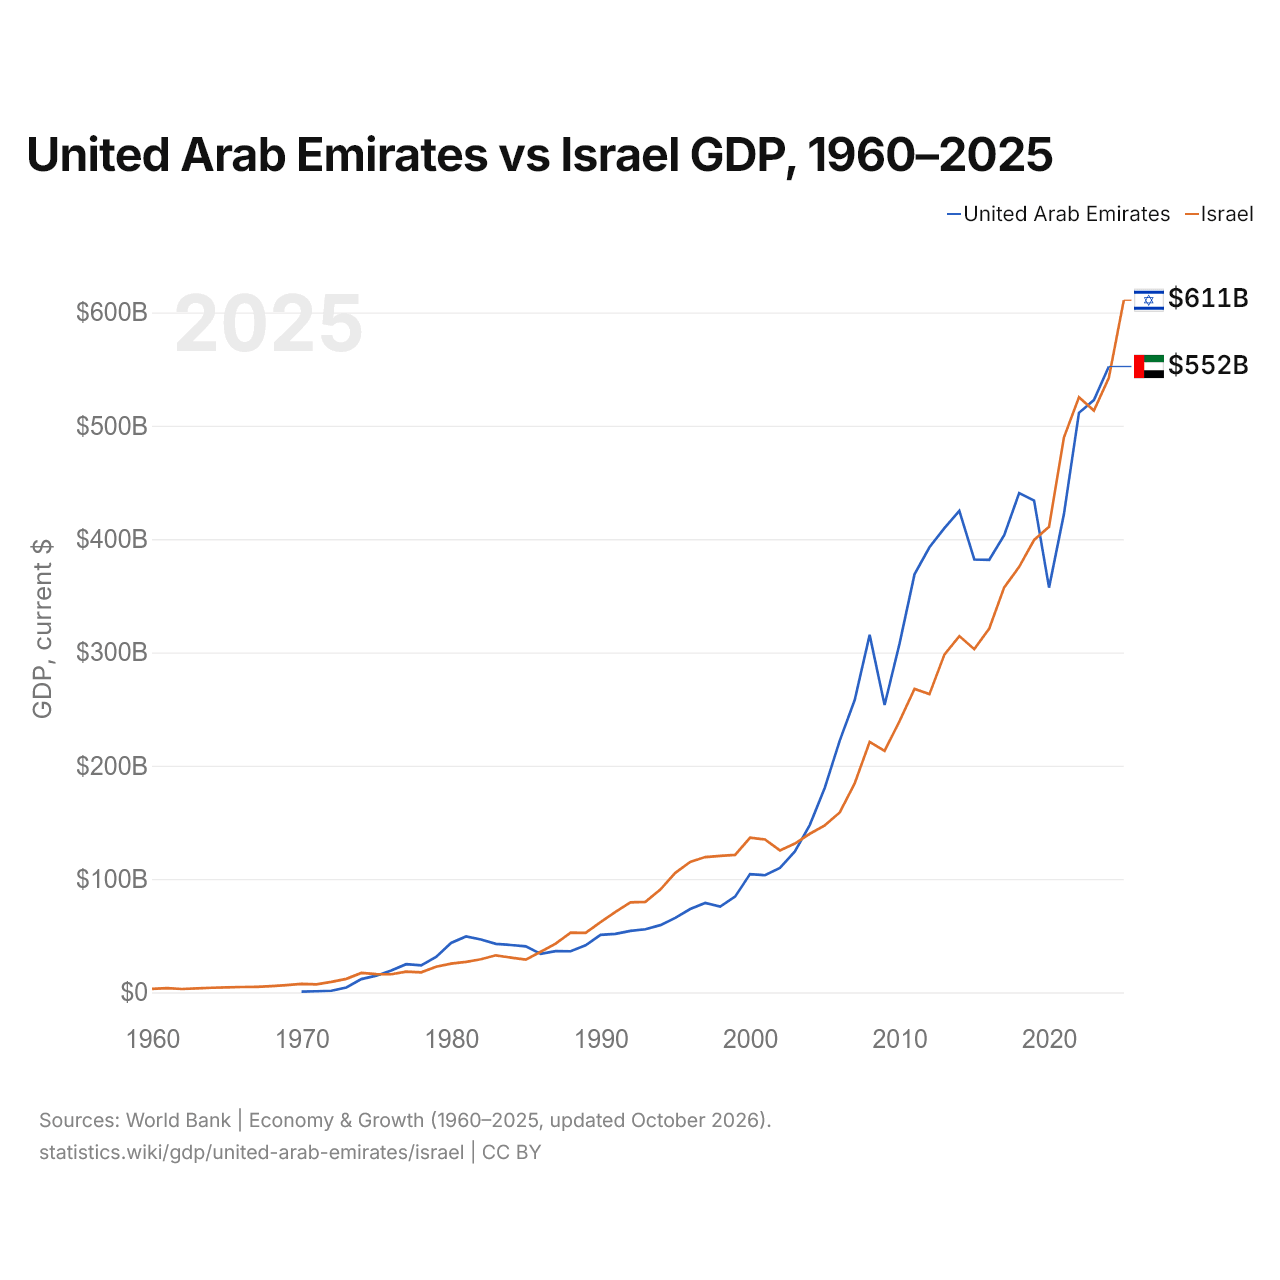
Le PIB des Émirats arabes unis (552 milliards de dollars US, 2024) était à peu près égal à celui d'Israël (542 milliards de dollars US, 2024). En 2014, l'écart était de 35 %. Depuis 2014, à prix constants de 2015, le PIB des Émirats arabes unis a progressé de 28,1 % et celui d'Israël de 41,4 %.
Depuis 2023, le PIB des Émirats arabes unis est le plus élevé des deux ; en 1970, celui d'Israël était 11 fois celui des Émirats arabes unis. Le PIB par habitant est de 50 274 $ US aux Émirats arabes unis (2024) et de 60 337 $ US en Israël (2025).
Émirats arabes unis vs Israël : derniers chiffres du PIB
|
EAU
|
Israël
|
|
|---|---|---|
| PIB, dollars US courants | 552 Md $US (2024) | 611 Md $US (2025) |
| Rang mondial | 31/197 | 27/197 |
| Part mondiale | 0,49 % | 0,52 % |
| PIB, dollars US constants de 2015 | 457 Md $US (2024) | 431 Md $US (2025) |
Comparer le PIB de 2 pays au choix
Sources :
- Banque mondiale | Économie et croissance (1960–2025, mis à jour en octobre 2026)
Creative Commons Attribution (CC BY) : vous pouvez copier, partager, adapter et réutiliser ce contenu, y compris à des fins commerciales, à condition de citer statistics.wiki et d’indiquer les modifications apportées. Les sources citées ci-dessus peuvent avoir leurs propres conditions de licence.