
Émirats arabes unis vs Singapour : PIB, 1960–2025
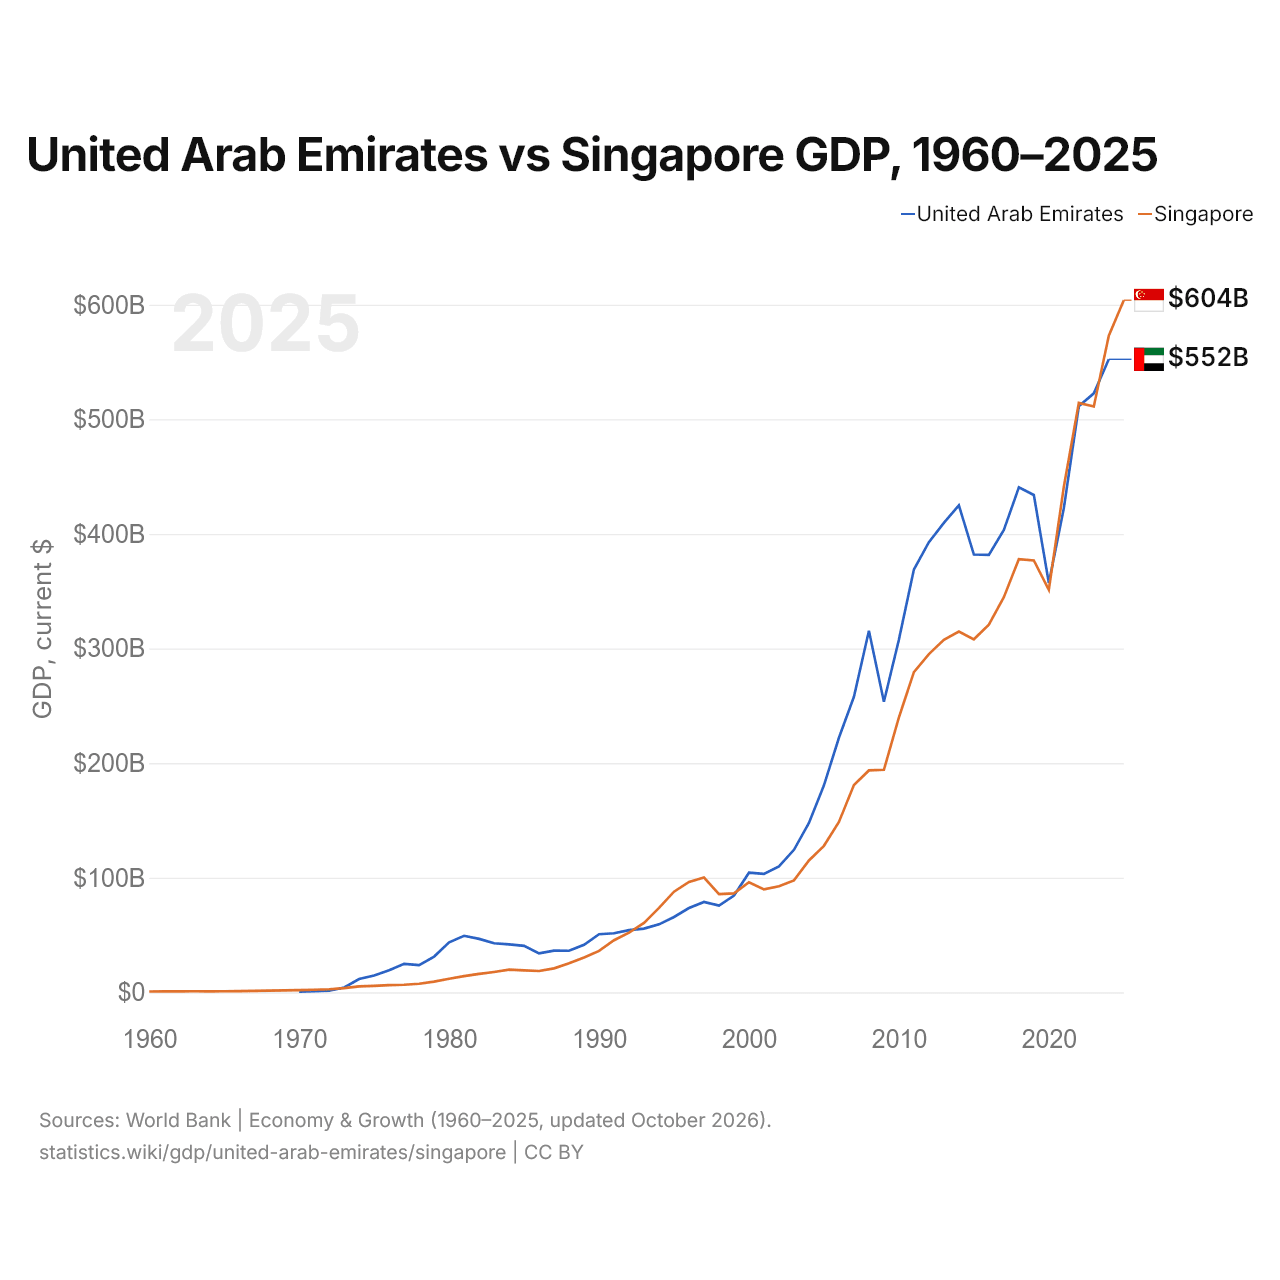
| Année | PIB, dollars US courants | |
|---|---|---|
 EAU |
 Singapour |
|
| 2025 | - | 603 869 516 999 $ US |
| 2024 | 552 324 919 096 $ US | 572 877 260 178 $ US |
| 2023 | 522 622 268 401 $ US | 511 181 761 244 $ US |
| 2022 | 511 403 404 642 $ US | 514 252 535 239 $ US |
| 2021 | 422 441 282 436 $ US | 441 110 903 525 $ US |
| 2020 | 357 161 776 271 $ US | 351 226 533 656 $ US |
| 2019 | 433 926 218 686 $ US | 376 827 390 962 $ US |
| 2018 | 440 560 003 161 $ US | 377 976 367 877 $ US |
| 2017 | 403 365 056 079 $ US | 344 795 119 214 $ US |
| 2016 | 381 717 208 621 $ US | 320 759 207 439 $ US |
| 2015 | 381 973 135 513 $ US | 307 998 545 269 $ US |
| 2014 | 424 935 834 104 $ US | 314 863 580 758 $ US |
| 2013 | 409 632 574 703 $ US | 307 576 360 585 $ US |
| 2012 | 392 793 559 051 $ US | 295 092 888 077 $ US |
| 2011 | 368 881 033 963 $ US | 279 356 499 090 $ US |
| 2010 | 307 736 348 527 $ US | 239 807 980 591 $ US |
| 2009 | 253 547 358 747 $ US | 194 150 283 772 $ US |
| 2008 | 315 474 615 741 $ US | 193 617 323 539 $ US |
| 2007 | 257 916 148 767 $ US | 180 941 701 358 $ US |
| 2006 | 222 116 532 963 $ US | 148 627 286 361 $ US |
| 2005 | 180 617 467 954 $ US | 127 807 848 728 $ US |
| 2004 | 147 824 249 958 $ US | 115 033 593 101 $ US |
| 2003 | 124 346 476 180 $ US | 97 646 401 096 $ US |
| 2002 | 109 816 091 079 $ US | 92 538 372 870 $ US |
| 2001 | 103 311 631 797 $ US | 89 793 790 670 $ US |
| 2000 | 104 337 463 730 $ US | 96 076 539 926 $ US |
| 1999 | 84 445 399 335 $ US | 86 286 849 755 $ US |
| 1998 | 75 674 384 205 $ US | 85 728 207 782 $ US |
| 1997 | 78 838 886 862 $ US | 100 123 787 215 $ US |
| 1996 | 73 571 217 377 $ US | 96 293 086 513 $ US |
| 1995 | 65 743 604 966 $ US | 87 812 540 788 $ US |
| 1994 | 59 305 111 228 $ US | 73 688 724 431 $ US |
| 1993 | 55 625 269 485 $ US | 60 603 815 716 $ US |
| 1992 | 54 239 188 746 $ US | 52 131 320 033 $ US |
| 1991 | 51 552 058 250 $ US | 45 466 164 978 $ US |
| 1990 | 50 701 374 187 $ US | 36 144 336 769 $ US |
| 1989 | 41 464 966 302 $ US | 30 465 364 739 $ US |
| 1988 | 36 275 613 877 $ US | 25 371 462 488 $ US |
| 1987 | 36 384 802 310 $ US | 20 919 215 578 $ US |
| 1986 | 33 943 568 481 $ US | 18 586 746 057 $ US |
| 1985 | 40 603 631 079 $ US | 19 156 532 746 $ US |
| 1984 | 41 807 931 453 $ US | 19 749 361 098 $ US |
| 1983 | 42 803 373 390 $ US | 17 784 112 150 $ US |
| 1982 | 46 622 715 281 $ US | 16 084 252 378 $ US |
| 1981 | 49 333 471 895 $ US | 14 175 228 844 $ US |
| 1980 | 43 599 134 193 $ US | 11 896 256 783 $ US |
| 1979 | 31 225 557 022 $ US | 9 296 921 724 $ US |
| 1978 | 23 775 718 541 $ US | 7 517 176 355 $ US |
| 1977 | 24 871 660 292 $ US | 6 618 585 074 $ US |
| 1976 | 19 213 212 475 $ US | 6 327 077 974 $ US |
| 1975 | 14 720 729 969 $ US | 5 633 673 930 $ US |
| 1974 | 11 651 505 689 $ US | 5 221 534 956 $ US |
| 1973 | 4 231 243 616 $ US | 3 696 213 333 $ US |
| 1972 | 1 415 086 929 $ US | 2 721 440 981 $ US |
| 1971 | 939 893 600 $ US | 2 263 785 444 $ US |
| 1970 | 685 986 701 $ US | 1 920 574 150 $ US |
| 1969 | - | 1 659 893 768 $ US |
| 1968 | - | 1 425 706 091 $ US |
| 1967 | - | 1 238 035 816 $ US |
| 1966 | - | 1 096 425 608 $ US |
| 1965 | - | 974 644 096 $ US |
| 1964 | - | 894 153 311 $ US |
| 1963 | - | 917 608 012 $ US |
| 1962 | - | 826 239 212 $ US |
| 1961 | - | 764 629 788 $ US |
| 1960 | - | 704 751 700 $ US |
Le PIB de Singapour (573 milliards de dollars US, 2024) était à peu près égal à celui des Émirats arabes unis (552 milliards de dollars US, 2024). En 2014, le plus élevé était celui des Émirats arabes unis : supérieur de 35 % à celui de Singapour. Depuis 2014, à prix constants de 2015, le PIB de Singapour a progressé de 37,5 % et celui des Émirats arabes unis de 28,1 %.
En 1970, le PIB de Singapour était 2,8 fois celui des Émirats arabes unis. Le PIB par habitant est de 50 274 $ US aux Émirats arabes unis (2024) et de 98 814 $ US à Singapour (2025).
Émirats arabes unis vs Singapour : derniers chiffres du PIB
|
EAU
|
Singapour
|
|
|---|---|---|
| PIB, dollars US courants | 552 Md $US (2024) | 604 Md $US (2025) |
| Rang mondial | 31/197 | 28/197 |
| Part mondiale | 0,49 % | 0,51 % |
| PIB, dollars US constants de 2015 | 457 Md $US (2024) | 432 Md $US (2025) |
Comparer le PIB de 2 pays au choix
Sources :
- Banque mondiale | Économie et croissance (1960–2025, mis à jour en octobre 2026)
Creative Commons Attribution (CC BY) : vous pouvez copier, partager, adapter et réutiliser ce contenu, y compris à des fins commerciales, à condition de citer statistics.wiki et d’indiquer les modifications apportées. Les sources citées ci-dessus peuvent avoir leurs propres conditions de licence.