
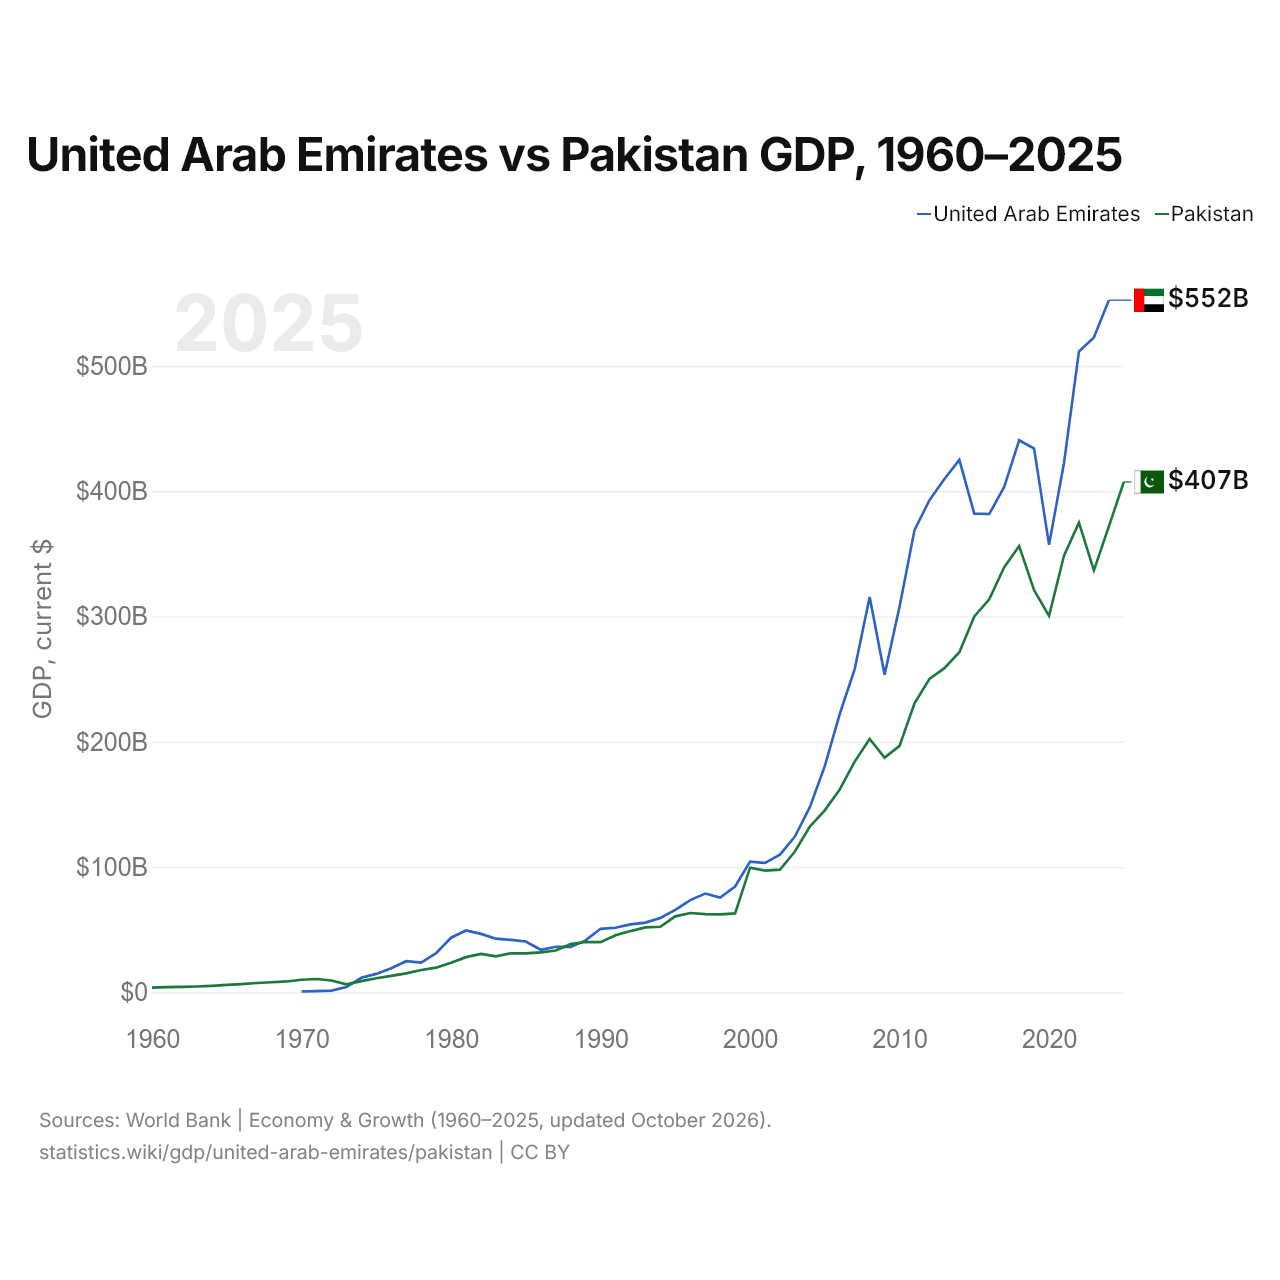
Émirats arabes unis vs Pakistan : PIB, 1960–2025
| Année | PIB, dollars US courants | |
|---|---|---|
 EAU |
 Pakistan |
|
| 2025 | - | 407 307 214 476 $ US |
| 2024 | 552 324 919 096 $ US | 371 747 087 751 $ US |
| 2023 | 522 622 268 401 $ US | 336 686 348 609 $ US |
| 2022 | 511 403 404 642 $ US | 374 890 295 667 $ US |
| 2021 | 422 441 282 436 $ US | 348 516 647 445 $ US |
| 2020 | 357 161 776 271 $ US | 300 425 609 818 $ US |
| 2019 | 433 926 218 686 $ US | 320 909 472 771 $ US |
| 2018 | 440 560 003 161 $ US | 356 128 166 705 $ US |
| 2017 | 403 365 056 079 $ US | 339 205 534 861 $ US |
| 2016 | 381 717 208 621 $ US | 313 630 000 130 $ US |
| 2015 | 381 973 135 513 $ US | 299 963 590 535 $ US |
| 2014 | 424 935 834 104 $ US | 271 390 474 858 $ US |
| 2013 | 409 632 574 703 $ US | 258 657 231 672 $ US |
| 2012 | 392 793 559 051 $ US | 250 106 966 105 $ US |
| 2011 | 368 881 033 963 $ US | 230 586 581 060 $ US |
| 2010 | 307 736 348 527 $ US | 196 709 621 850 $ US |
| 2009 | 253 547 358 747 $ US | 187 337 783 856 $ US |
| 2008 | 315 474 615 741 $ US | 202 203 748 584 $ US |
| 2007 | 257 916 148 767 $ US | 184 140 869 997 $ US |
| 2006 | 222 116 532 963 $ US | 161 871 385 506 $ US |
| 2005 | 180 617 467 954 $ US | 145 208 562 961 $ US |
| 2004 | 147 824 249 958 $ US | 132 216 048 339 $ US |
| 2003 | 124 346 476 180 $ US | 112 371 913 741 $ US |
| 2002 | 109 816 091 079 $ US | 97 923 302 809 $ US |
| 2001 | 103 311 631 797 $ US | 97 145 618 480 $ US |
| 2000 | 104 337 463 730 $ US | 99 484 802 345 $ US |
| 1999 | 84 445 399 335 $ US | 62 973 857 069 $ US |
| 1998 | 75 674 384 205 $ US | 62 191 955 814 $ US |
| 1997 | 78 838 886 862 $ US | 62 433 340 468 $ US |
| 1996 | 73 571 217 377 $ US | 63 320 170 084 $ US |
| 1995 | 65 743 604 966 $ US | 60 636 071 684 $ US |
| 1994 | 59 305 111 228 $ US | 52 293 470 813 $ US |
| 1993 | 55 625 269 485 $ US | 51 809 999 353 $ US |
| 1992 | 54 239 188 746 $ US | 48 884 671 947 $ US |
| 1991 | 51 552 058 250 $ US | 45 625 336 680 $ US |
| 1990 | 50 701 374 187 $ US | 40 010 423 970 $ US |
| 1989 | 41 464 966 302 $ US | 40 171 106 279 $ US |
| 1988 | 36 275 613 877 $ US | 38 472 742 808 $ US |
| 1987 | 36 384 802 310 $ US | 33 351 529 275 $ US |
| 1986 | 33 943 568 481 $ US | 31 899 070 056 $ US |
| 1985 | 40 603 631 079 $ US | 31 144 920 844 $ US |
| 1984 | 41 807 931 453 $ US | 31 151 825 467 $ US |
| 1983 | 42 803 373 390 $ US | 28 691 889 764 $ US |
| 1982 | 46 622 715 281 $ US | 30 725 971 564 $ US |
| 1981 | 49 333 471 895 $ US | 28 100 606 061 $ US |
| 1980 | 43 599 134 193 $ US | 23 654 444 444 $ US |
| 1979 | 31 225 557 022 $ US | 19 688 383 838 $ US |
| 1978 | 23 775 718 541 $ US | 17 811 515 152 $ US |
| 1977 | 24 871 660 292 $ US | 15 126 060 606 $ US |
| 1976 | 19 213 212 475 $ US | 13 168 080 808 $ US |
| 1975 | 14 720 729 969 $ US | 11 230 606 061 $ US |
| 1974 | 11 651 505 689 $ US | 8 899 191 919 $ US |
| 1973 | 4 231 243 616 $ US | 6 383 429 490 $ US |
| 1972 | 1 415 086 929 $ US | 9 415 016 360 $ US |
| 1971 | 939 893 600 $ US | 10 665 896 682 $ US |
| 1970 | 685 986 701 $ US | 10 027 509 450 $ US |
| 1969 | - | 8 683 116 338 $ US |
| 1968 | - | 8 041 999 160 $ US |
| 1967 | - | 7 464 510 710 $ US |
| 1966 | - | 6 561 108 778 $ US |
| 1965 | - | 5 929 231 415 $ US |
| 1964 | - | 5 204 955 901 $ US |
| 1963 | - | 4 630 827 383 $ US |
| 1962 | - | 4 310 163 797 $ US |
| 1961 | - | 4 118 647 627 $ US |
| 1960 | - | 3 749 265 015 $ US |
Le PIB des Émirats arabes unis (552 milliards de dollars US, 2024) était supérieur de 49 % à celui du Pakistan (372 milliards de dollars US, 2024). En 2014, le rapport était de 1,6. Depuis 2014, à prix constants de 2015, le PIB des Émirats arabes unis a progressé de 28,1 % et celui du Pakistan de 42,7 %.
Depuis 1989, le PIB des Émirats arabes unis est le plus élevé des deux ; en 1970, celui du Pakistan était 15 fois celui des Émirats arabes unis. Le PIB par habitant est de 50 274 $ US aux Émirats arabes unis (2024) et de 1 596 $ US au Pakistan (2025). En parité de pouvoir d'achat, l'ordre s'inverse : le PIB (PPA) est de 1,68 billion de dollars au Pakistan (2025) et de 872 milliards de dollars aux Émirats arabes unis (2024).
Émirats arabes unis vs Pakistan : derniers chiffres du PIB
|
EAU
|
Pakistan
|
|
|---|---|---|
| PIB, dollars US courants | 552 Md $US (2024) | 407 Md $US (2025) |
| Rang mondial | 31/197 | 41/197 |
| Part mondiale | 0,49 % | 0,34 % |
| PIB, dollars US constants de 2015 | 457 Md $US (2024) | 426 Md $US (2025) |
Comparer le PIB de 2 pays au choix
Sources :
- Banque mondiale | Économie et croissance (1960–2025, mis à jour en octobre 2026)
Creative Commons Attribution (CC BY) : vous pouvez copier, partager, adapter et réutiliser ce contenu, y compris à des fins commerciales, à condition de citer statistics.wiki et d’indiquer les modifications apportées. Les sources citées ci-dessus peuvent avoir leurs propres conditions de licence.