
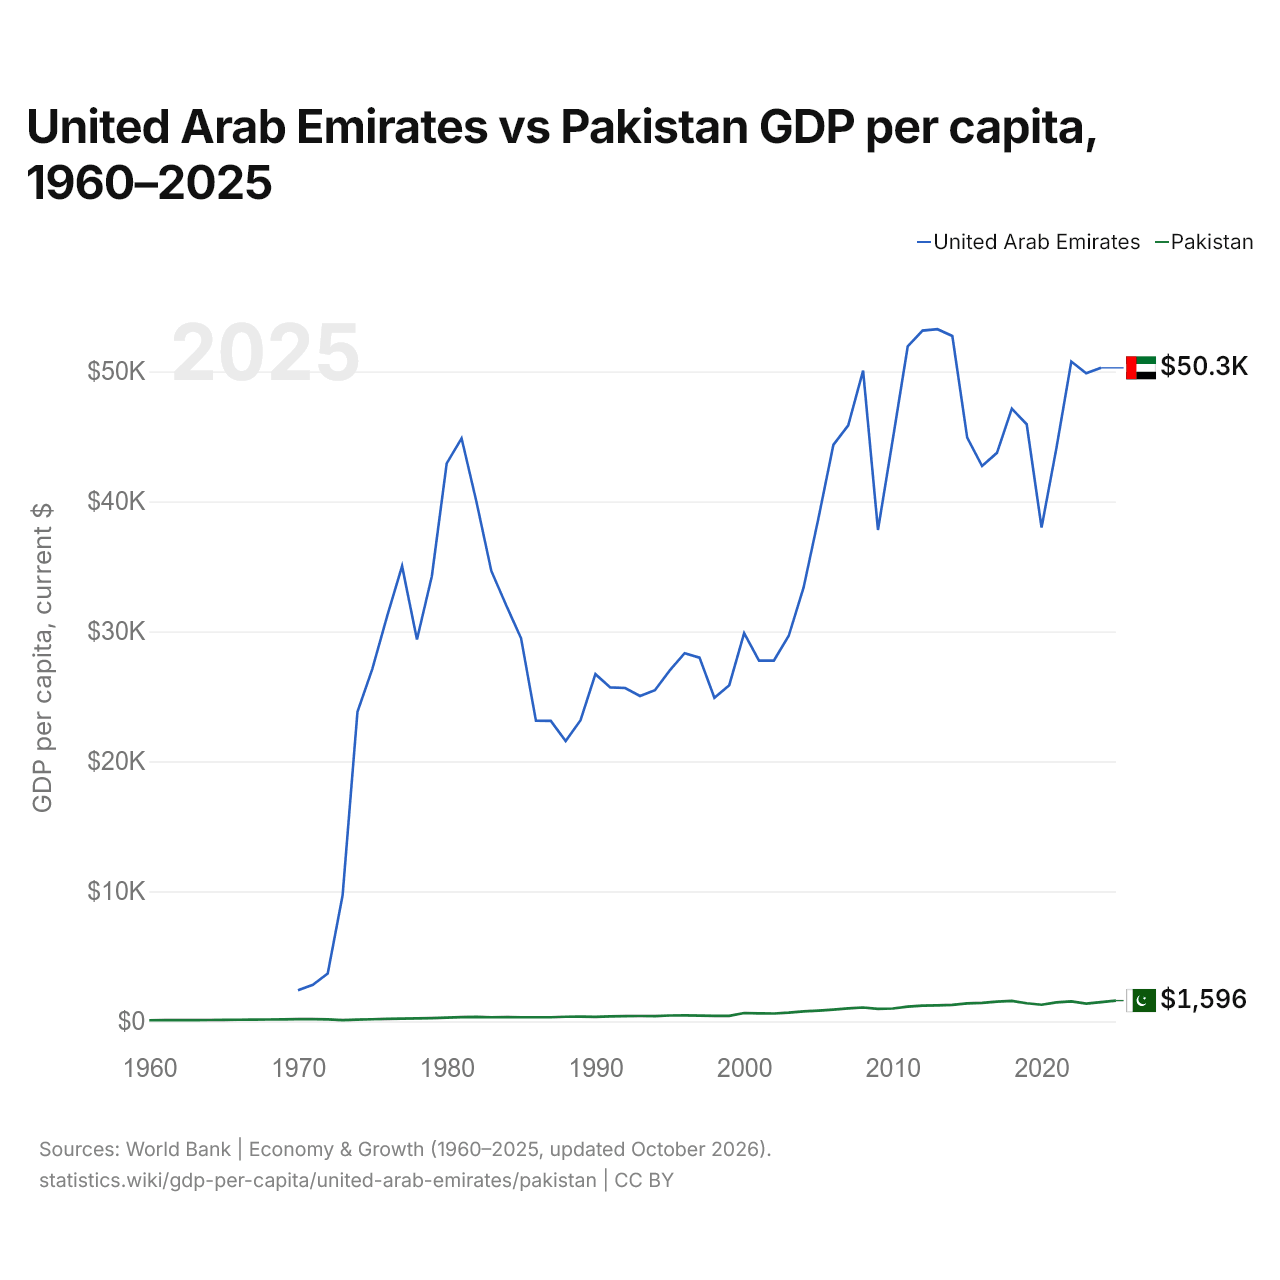
Émirats arabes unis vs Pakistan : PIB par habitant, 1960–2025
| Année | PIB par habitant, dollars US courants | |
|---|---|---|
 EAU |
 Pakistan |
|
| 2025 | - | 1 596 $ US |
| 2024 | 50 274 $ US | 1 479 $ US |
| 2023 | 49 851 $ US | 1 360 $ US |
| 2022 | 50 760 $ US | 1 538 $ US |
| 2021 | 44 118 $ US | 1 455 $ US |
| 2020 | 37 992 $ US | 1 278 $ US |
| 2019 | 45 939 $ US | 1 390 $ US |
| 2018 | 47 135 $ US | 1 569 $ US |
| 2017 | 43 734 $ US | 1 519 $ US |
| 2016 | 42 721 $ US | 1 425 $ US |
| 2015 | 44 910 $ US | 1 380 $ US |
| 2014 | 52 725 $ US | 1 267 $ US |
| 2013 | 53 247 $ US | 1 225 $ US |
| 2012 | 53 142 $ US | 1 204 $ US |
| 2011 | 51 922 $ US | 1 132 $ US |
| 2010 | 44 795 $ US | 987 $ US |
| 2009 | 37 803 $ US | 964 $ US |
| 2008 | 50 054 $ US | 1 067 $ US |
| 2007 | 45 855 $ US | 998 $ US |
| 2006 | 44 343 $ US | 901 $ US |
| 2005 | 38 719 $ US | 828 $ US |
| 2004 | 33 377 $ US | 772 $ US |
| 2003 | 29 660 $ US | 672 $ US |
| 2002 | 27 754 $ US | 600 $ US |
| 2001 | 27 745 $ US | 610 $ US |
| 2000 | 29 866 $ US | 642 $ US |
| 1999 | 25 856 $ US | 418 $ US |
| 1998 | 24 889 $ US | 424 $ US |
| 1997 | 27 983 $ US | 438 $ US |
| 1996 | 28 323 $ US | 457 $ US |
| 1995 | 27 003 $ US | 451 $ US |
| 1994 | 25 473 $ US | 400 $ US |
| 1993 | 25 033 $ US | 408 $ US |
| 1992 | 25 648 $ US | 396 $ US |
| 1991 | 25 691 $ US | 380 $ US |
| 1990 | 26 710 $ US | 344 $ US |
| 1989 | 23 167 $ US | 358 $ US |
| 1988 | 21 570 $ US | 354 $ US |
| 1987 | 23 113 $ US | 317 $ US |
| 1986 | 23 132 $ US | 314 $ US |
| 1985 | 29 468 $ US | 317 $ US |
| 1984 | 32 012 $ US | 327 $ US |
| 1983 | 34 650 $ US | 311 $ US |
| 1982 | 39 972 $ US | 345 $ US |
| 1981 | 44 855 $ US | 328 $ US |
| 1980 | 42 925 $ US | 287,4 $ US |
| 1979 | 34 238 $ US | 249,2 $ US |
| 1978 | 29 379 $ US | 233,4 $ US |
| 1977 | 35 020 $ US | 204,7 $ US |
| 1976 | 31 197 $ US | 183,9 $ US |
| 1975 | 27 117 $ US | 161,7 $ US |
| 1974 | 23 823 $ US | 132 $ US |
| 1973 | 9 696 $ US | 97,5 $ US |
| 1972 | 3 675 $ US | 148,1 $ US |
| 1971 | 2 805 $ US | 172,5 $ US |
| 1970 | 2 394 $ US | 166,7 $ US |
| 1969 | - | 148,5 $ US |
| 1968 | - | 141,6 $ US |
| 1967 | - | 135,2 $ US |
| 1966 | - | 122,2 $ US |
| 1965 | - | 113,6 $ US |
| 1964 | - | 102,5 $ US |
| 1963 | - | 93,7 $ US |
| 1962 | - | 89,5 $ US |
| 1961 | - | 87,8 $ US |
| 1960 | - | 82 $ US |
Le PIB par habitant était de 50 274 $ US aux Émirats arabes unis (2024) et de 1 479 $ US au Pakistan (2024) : 34 fois plus élevé aux Émirats arabes unis. En 1970, il était de 2 394 $ US aux Émirats arabes unis et de 167 $ US au Pakistan, soit 14 fois plus aux Émirats arabes unis.
Le PIB par habitant des Émirats arabes unis est plus élevé que celui du Pakistan chaque année depuis 1970. À prix constants de 2015, depuis 1970, le PIB par habitant des Émirats arabes unis a reculé de 15 %, et celui du Pakistan a progressé de 159 %.
Émirats arabes unis vs Pakistan : derniers chiffres du PIB par habitant
|
EAU
|
Pakistan
|
|
|---|---|---|
| PIB par habitant, dollars US courants | 50 274 $US (2024) | 1 596 $US (2025) |
| Rang mondial | 25/197 | 164/197 |
| PIB par habitant, dollars US constants de 2015 | 41 605 $US (2024) | 1 669 $US (2025) |
| × moyenne mondiale | 3,67× | 0,11× |
Comparer le PIB par habitant de 2 pays au choix
Sources :
- Banque mondiale | Économie et croissance (1960–2025, mis à jour en octobre 2026)
Creative Commons Attribution (CC BY) : vous pouvez copier, partager, adapter et réutiliser ce contenu, y compris à des fins commerciales, à condition de citer statistics.wiki et d’indiquer les modifications apportées. Les sources citées ci-dessus peuvent avoir leurs propres conditions de licence.