
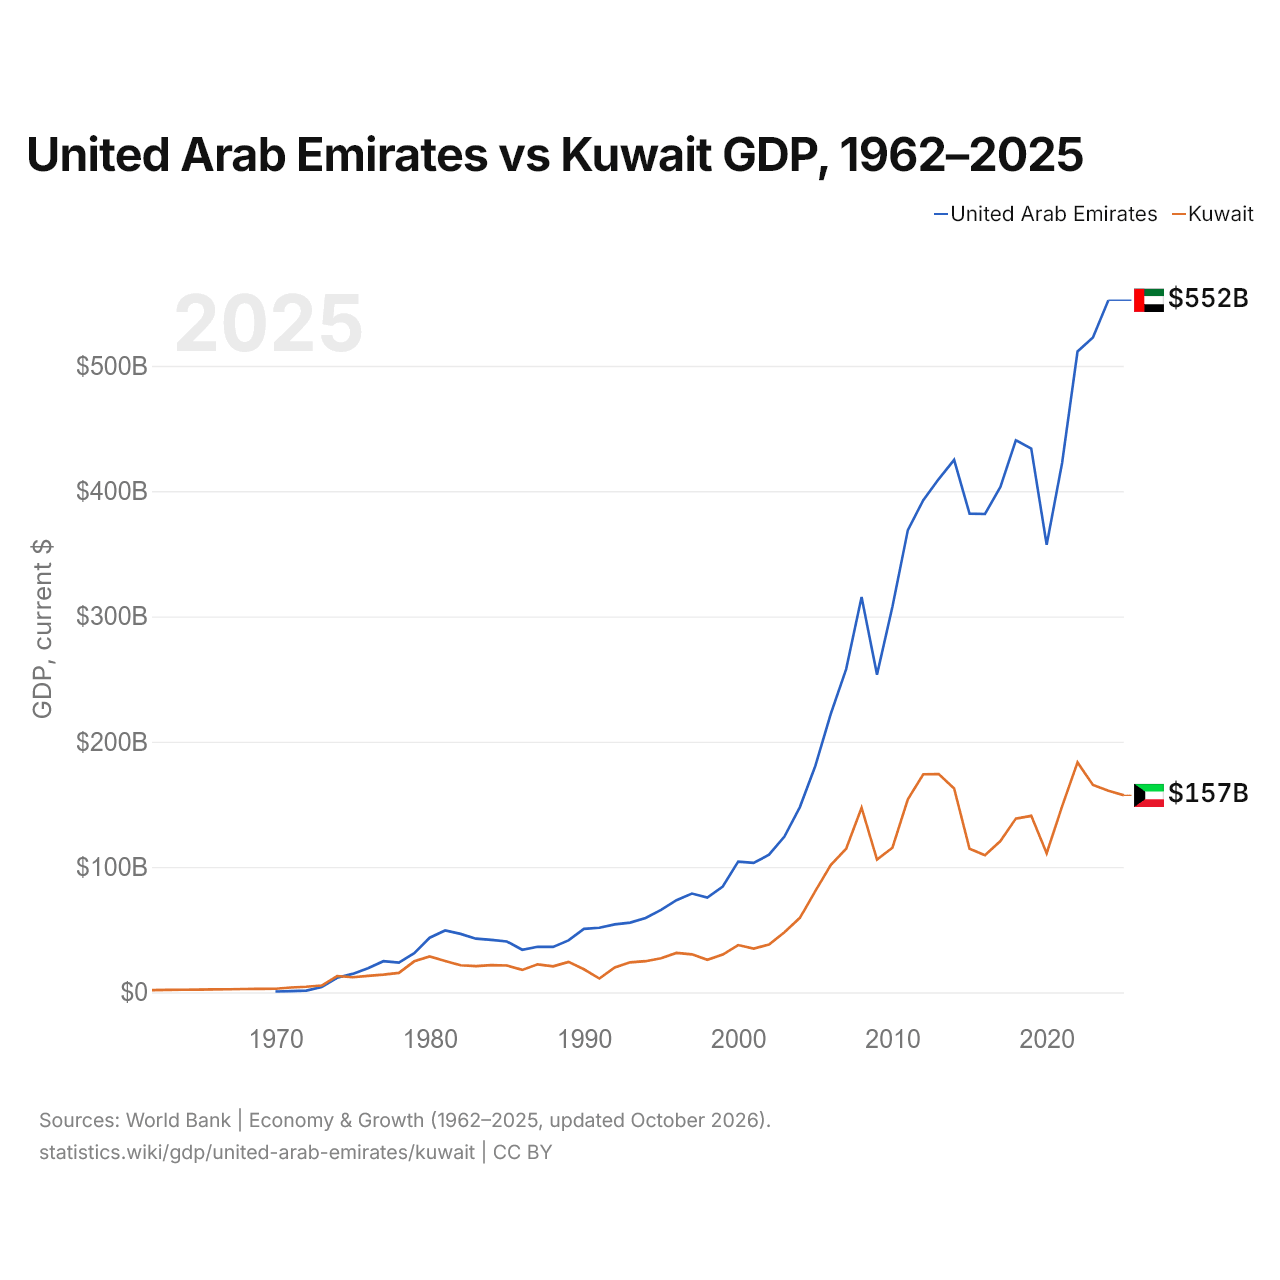
Émirats arabes unis vs Koweït : PIB, 1962–2025
| Année | PIB, dollars US courants | |
|---|---|---|
 EAU |
 Koweït |
|
| 2025 | - | 157 209 026 926 $ US |
| 2024 | 552 324 919 096 $ US | 160 903 106 639 $ US |
| 2023 | 522 622 268 401 $ US | 165 462 656 227 $ US |
| 2022 | 511 403 404 642 $ US | 183 502 046 694 $ US |
| 2021 | 422 441 282 436 $ US | 148 350 671 489 $ US |
| 2020 | 357 161 776 271 $ US | 111 045 470 606 $ US |
| 2019 | 433 926 218 686 $ US | 140 856 394 861 $ US |
| 2018 | 440 560 003 161 $ US | 138 646 316 351 $ US |
| 2017 | 403 365 056 079 $ US | 120 687 539 806 $ US |
| 2016 | 381 717 208 621 $ US | 109 406 674 125 $ US |
| 2015 | 381 973 135 513 $ US | 114 585 555 689 $ US |
| 2014 | 424 935 834 104 $ US | 162 650 450 685 $ US |
| 2013 | 409 632 574 703 $ US | 174 168 116 535 $ US |
| 2012 | 392 793 559 051 $ US | 174 047 662 680 $ US |
| 2011 | 368 881 033 963 $ US | 154 039 231 246 $ US |
| 2010 | 307 736 348 527 $ US | 115 416 245 242 $ US |
| 2009 | 253 547 358 747 $ US | 105 968 691 905 $ US |
| 2008 | 315 474 615 741 $ US | 147 379 737 230 $ US |
| 2007 | 257 916 148 767 $ US | 114 634 043 362 $ US |
| 2006 | 222 116 532 963 $ US | 101 557 330 723 $ US |
| 2005 | 180 617 467 954 $ US | 80 798 630 137 $ US |
| 2004 | 147 824 249 958 $ US | 59 439 090 601 $ US |
| 2003 | 124 346 476 180 $ US | 47 874 582 232 $ US |
| 2002 | 109 816 091 079 $ US | 38 135 788 414 $ US |
| 2001 | 103 311 631 797 $ US | 34 889 559 870 $ US |
| 2000 | 104 337 463 730 $ US | 37 718 743 480 $ US |
| 1999 | 84 445 399 335 $ US | 30 122 365 849 $ US |
| 1998 | 75 674 384 205 $ US | 25 943 705 784 $ US |
| 1997 | 78 838 886 862 $ US | 30 350 190 704 $ US |
| 1996 | 73 571 217 377 $ US | 31 492 373 309 $ US |
| 1995 | 65 743 604 966 $ US | 27 186 980 647 $ US |
| 1994 | 59 305 111 228 $ US | 24 848 483 838 $ US |
| 1993 | 55 625 269 485 $ US | 23 941 391 391 $ US |
| 1992 | 54 239 188 746 $ US | 19 858 555 215 $ US |
| 1991 | 51 552 058 250 $ US | 11 009 993 703 $ US |
| 1990 | 50 701 374 187 $ US | 18 427 777 778 $ US |
| 1989 | 41 464 966 302 $ US | 24 313 855 653 $ US |
| 1988 | 36 275 613 877 $ US | 20 690 322 153 $ US |
| 1987 | 36 384 802 310 $ US | 22 368 704 134 $ US |
| 1986 | 33 943 568 481 $ US | 17 903 989 745 $ US |
| 1985 | 40 603 631 079 $ US | 21 445 970 614 $ US |
| 1984 | 41 807 931 453 $ US | 21 700 082 753 $ US |
| 1983 | 42 803 373 390 $ US | 20 871 081 080 $ US |
| 1982 | 46 622 715 281 $ US | 21 577 153 356 $ US |
| 1981 | 49 333 471 895 $ US | 25 058 020 338 $ US |
| 1980 | 43 599 134 193 $ US | 28 638 868 356 $ US |
| 1979 | 31 225 557 022 $ US | 24 749 063 922 $ US |
| 1978 | 23 775 718 541 $ US | 15 503 557 496 $ US |
| 1977 | 24 871 660 292 $ US | 14 137 406 741 $ US |
| 1976 | 19 213 212 475 $ US | 13 132 252 802 $ US |
| 1975 | 14 720 729 969 $ US | 12 022 811 621 $ US |
| 1974 | 11 651 505 689 $ US | 13 006 948 296 $ US |
| 1973 | 4 231 243 616 $ US | 5 408 804 607 $ US |
| 1972 | 1 415 086 929 $ US | 4 450 537 925 $ US |
| 1971 | 939 893 600 $ US | 3 880 392 195 $ US |
| 1970 | 685 986 701 $ US | 2 873 638 851 $ US |
| 1969 | - | 2 769 198 892 $ US |
| 1968 | - | 2 662 798 935 $ US |
| 1967 | - | 2 441 599 023 $ US |
| 1966 | - | 2 391 199 044 $ US |
| 1965 | - | 2 097 199 161 $ US |
| 1964 | - | 2 071 668 533 $ US |
| 1963 | - | 1 900 895 857 $ US |
| 1962 | - | 1 828 107 503 $ US |
Le PIB des Émirats arabes unis (552 milliards de dollars US, 2024) était 3,4 fois celui du Koweït (161 milliards de dollars US, 2024). En 2014, le rapport était de 2,6. Depuis 2014, à prix constants de 2015, le PIB des Émirats arabes unis a progressé de 28,1 % et celui du Koweït de 3,8 %.
Depuis 1975, le PIB des Émirats arabes unis est le plus élevé des deux ; en 1970, celui du Koweït était 4,2 fois celui des Émirats arabes unis. Le PIB par habitant est de 50 274 $ US aux Émirats arabes unis (2024) et de 32 312 $ US au Koweït (2025).
Émirats arabes unis vs Koweït : derniers chiffres du PIB
|
EAU
|
Koweït
|
|
|---|---|---|
| PIB, dollars US courants | 552 Md $US (2024) | 157 Md $US (2025) |
| Rang mondial | 31/197 | 59/197 |
| Part mondiale | 0,49 % | 0,13 % |
| PIB, dollars US constants de 2015 | 457 Md $US (2024) | 121 Md $US (2025) |
Comparer le PIB de 2 pays au choix
Sources :
- Banque mondiale | Économie et croissance (1962–2025, mis à jour en octobre 2026)
Creative Commons Attribution (CC BY) : vous pouvez copier, partager, adapter et réutiliser ce contenu, y compris à des fins commerciales, à condition de citer statistics.wiki et d’indiquer les modifications apportées. Les sources citées ci-dessus peuvent avoir leurs propres conditions de licence.