
Israël vs Égypte : PIB, 1960–2025
| Année | PIB, dollars US courants | |
|---|---|---|
 Israël |
 Égypte |
|
| 2025 | 610 777 842 874 $ US | 365 254 630 180 $ US |
| 2024 | 542 284 494 491 $ US | 389 059 910 593 $ US |
| 2023 | 513 393 395 492 $ US | 395 926 071 448 $ US |
| 2022 | 525 157 951 213 $ US | 476 747 720 365 $ US |
| 2021 | 489 735 019 666 $ US | 424 671 765 456 $ US |
| 2020 | 410 908 899 711 $ US | 383 817 841 547 $ US |
| 2019 | 399 207 771 082 $ US | 318 678 815 490 $ US |
| 2018 | 375 470 422 244 $ US | 262 588 632 527 $ US |
| 2017 | 357 360 816 857 $ US | 248 362 771 739 $ US |
| 2016 | 321 083 954 798 $ US | 332 441 717 791 $ US |
| 2015 | 302 841 190 258 $ US | 329 366 576 819 $ US |
| 2014 | 314 376 760 832 $ US | 305 595 408 895 $ US |
| 2013 | 298 045 324 736 $ US | 288 434 108 527 $ US |
| 2012 | 263 172 104 091 $ US | 279 116 666 667 $ US |
| 2011 | 267 739 352 609 $ US | 235 989 672 978 $ US |
| 2010 | 239 372 857 534 $ US | 218 983 666 062 $ US |
| 2009 | 213 112 649 594 $ US | 189 147 005 445 $ US |
| 2008 | 220 952 472 408 $ US | 162 818 181 818 $ US |
| 2007 | 184 448 882 452 $ US | 130 437 828 371 $ US |
| 2006 | 158 706 516 002 $ US | 107 426 086 957 $ US |
| 2005 | 147 346 035 831 $ US | 89 660 339 660 $ US |
| 2004 | 139 925 423 025 $ US | 78 782 467 532 $ US |
| 2003 | 131 278 887 815 $ US | 80 288 461 538 $ US |
| 2002 | 125 215 963 105 $ US | 85 146 067 416 $ US |
| 2001 | 134 889 159 474 $ US | 96 684 636 119 $ US |
| 2000 | 136 409 902 632 $ US | 99 838 543 960 $ US |
| 1999 | 121 329 240 042 $ US | 90 710 704 807 $ US |
| 1998 | 120 468 659 246 $ US | 84 828 807 556 $ US |
| 1997 | 119 389 303 067 $ US | 78 436 578 171 $ US |
| 1996 | 115 051 957 577 $ US | 67 629 716 981 $ US |
| 1995 | 105 432 315 611 $ US | 60 159 245 060 $ US |
| 1994 | 90 684 108 118 $ US | 51 897 983 393 $ US |
| 1993 | 79 806 598 120 $ US | 46 578 631 453 $ US |
| 1992 | 79 408 652 426 $ US | 41 855 986 519 $ US |
| 1991 | 70 954 941 681 $ US | 37 387 836 491 $ US |
| 1990 | 61 978 459 022 $ US | 42 978 914 311 $ US |
| 1989 | 52 411 116 588 $ US | 39 756 299 050 $ US |
| 1988 | 52 618 458 014 $ US | 34 980 124 929 $ US |
| 1987 | 43 022 977 765 $ US | 40 455 616 654 $ US |
| 1986 | 35 812 041 620 $ US | 41 253 507 951 $ US |
| 1985 | 28 887 898 639 $ US | 39 053 502 251 $ US |
| 1984 | 30 626 695 891 $ US | 33 971 188 992 $ US |
| 1983 | 32 655 591 256 $ US | 30 966 239 814 $ US |
| 1982 | 29 237 231 967 $ US | 27 655 172 414 $ US |
| 1981 | 26 865 420 933 $ US | 22 136 081 081 $ US |
| 1980 | 25 379 585 067 $ US | 21 669 908 176 $ US |
| 1979 | 22 595 788 591 $ US | 18 020 571 429 $ US |
| 1978 | 17 690 363 444 $ US | 14 811 704 063 $ US |
| 1977 | 18 245 847 441 $ US | 14 400 806 876 $ US |
| 1976 | 15 946 502 888 $ US | 13 315 988 083 $ US |
| 1975 | 16 131 806 290 $ US | 11 632 178 869 $ US |
| 1974 | 17 162 009 924 $ US | 9 228 963 225 $ US |
| 1973 | 11 895 229 181 $ US | 10 098 534 613 $ US |
| 1972 | 9 216 866 299 $ US | 9 299 638 056 $ US |
| 1971 | 7 048 191 876 $ US | 8 609 283 346 $ US |
| 1970 | 7 402 142 195 $ US | 8 042 200 452 $ US |
| 1969 | 6 293 966 357 $ US | 6 524 455 206 $ US |
| 1968 | 5 455 059 532 $ US | 5 932 242 991 $ US |
| 1967 | 4 759 447 914 $ US | 5 605 484 299 $ US |
| 1966 | 4 700 397 692 $ US | 5 278 005 612 $ US |
| 1965 | 4 326 412 951 $ US | 4 948 667 540 $ US |
| 1964 | 4 021 861 430 $ US | 4 709 245 762 $ US |
| 1963 | 3 533 767 055 $ US | 4 187 146 232 $ US |
| 1962 | 2 964 323 618 $ US | 4 035 462 027 $ US |
| 1961 | 3 706 297 903 $ US | 4 494 575 611 $ US |
| 1960 | 3 068 690 949 $ US | 4 206 270 352 $ US |
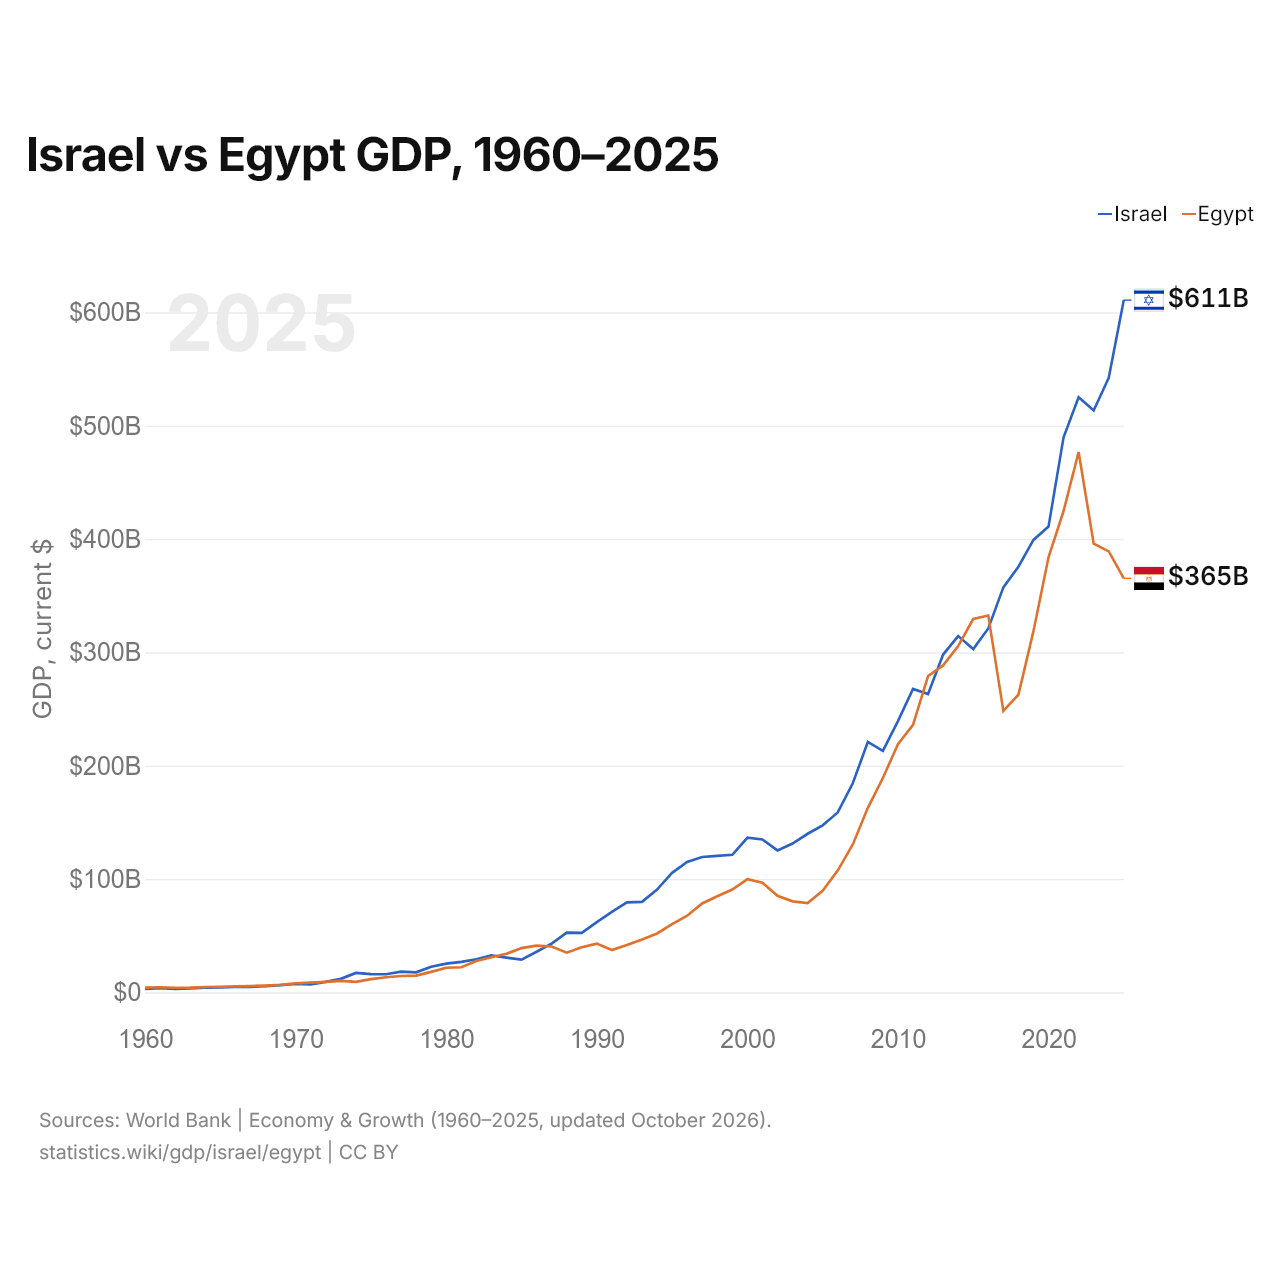
En 2025, le PIB d'Israël (611 milliards de dollars US) était 1,7 fois celui de l'Égypte (365 milliards de dollars US). En 2015, le plus élevé était celui de l'Égypte : supérieur de 8,8 % à celui d'Israël. De 2015 à 2025, à prix constants de 2015, le PIB d'Israël a progressé de 42,4 % et celui de l'Égypte de 52,8 %.
Depuis 2017, le PIB d'Israël est le plus élevé des deux ; en 1960, celui de l'Égypte était supérieur de 37 % à celui d'Israël. En 2025, le PIB par habitant était de 60 337 $ US en Israël et de 3 086 $ US en Égypte, soit 20 fois plus élevé en Israël. En parité de pouvoir d'achat, l'ordre s'inverse : le PIB (PPA) est de 2,39 billions de dollars en Égypte et de 605 milliards de dollars en Israël.
Israël vs Égypte : derniers chiffres du PIB
|
Israël
|
Égypte
|
|
|---|---|---|
| PIB, dollars US courants | 611 Md $US | 365 Md $US |
| Rang mondial | 27/197 | 43/197 |
| Part mondiale | 0,52 % | 0,31 % |
| PIB, dollars US constants de 2015 | 431 Md $US | 503 Md $US |
| Écart de PIB | 1,7× | 0,6× |
Comparer le PIB de 2 pays au choix
Sources :
- Banque mondiale | Économie et croissance (1960–2025, mis à jour en octobre 2026)
Creative Commons Attribution (CC BY) : vous pouvez copier, partager, adapter et réutiliser ce contenu, y compris à des fins commerciales, à condition de citer statistics.wiki et d’indiquer les modifications apportées. Les sources citées ci-dessus peuvent avoir leurs propres conditions de licence.