
Égypte vs Argentine : PIB, 1960–2025
| Année | PIB, dollars US courants | |
|---|---|---|
 Égypte |
 Argentine |
|
| 2025 | 365 254 630 180 $ US | 683 097 891 619 $ US |
| 2024 | 389 059 910 593 $ US | 638 365 455 340 $ US |
| 2023 | 395 926 071 448 $ US | 649 461 687 959 $ US |
| 2022 | 476 747 720 365 $ US | 633 993 756 301 $ US |
| 2021 | 424 671 765 456 $ US | 486 564 085 480 $ US |
| 2020 | 383 817 841 547 $ US | 385 740 508 437 $ US |
| 2019 | 318 678 815 490 $ US | 447 754 683 615 $ US |
| 2018 | 262 588 632 527 $ US | 524 819 892 360 $ US |
| 2017 | 248 362 771 739 $ US | 643 628 393 281 $ US |
| 2016 | 332 441 717 791 $ US | 557 532 320 663 $ US |
| 2015 | 329 366 576 819 $ US | 594 749 285 413 $ US |
| 2014 | 305 595 408 895 $ US | 526 319 673 732 $ US |
| 2013 | 288 434 108 527 $ US | 552 025 140 252 $ US |
| 2012 | 279 116 666 667 $ US | 545 982 375 701 $ US |
| 2011 | 235 989 672 978 $ US | 530 158 122 010 $ US |
| 2010 | 218 983 666 062 $ US | 423 627 422 092 $ US |
| 2009 | 189 147 005 445 $ US | 332 976 484 578 $ US |
| 2008 | 162 818 181 818 $ US | 361 558 037 110 $ US |
| 2007 | 130 437 828 371 $ US | 287 530 508 431 $ US |
| 2006 | 107 426 086 957 $ US | 232 557 260 817 $ US |
| 2005 | 89 660 339 660 $ US | 198 737 095 012 $ US |
| 2004 | 78 782 467 532 $ US | 164 657 930 453 $ US |
| 2003 | 80 288 461 538 $ US | 127 586 973 492 $ US |
| 2002 | 85 146 067 416 $ US | 97 724 004 252 $ US |
| 2001 | 96 684 636 119 $ US | 268 696 750 000 $ US |
| 2000 | 99 838 543 960 $ US | 284 203 750 000 $ US |
| 1999 | 90 710 704 807 $ US | 283 523 000 000 $ US |
| 1998 | 84 828 807 556 $ US | 298 948 250 000 $ US |
| 1997 | 78 436 578 171 $ US | 292 859 000 000 $ US |
| 1996 | 67 629 716 981 $ US | 272 149 750 000 $ US |
| 1995 | 60 159 245 060 $ US | 258 031 750 000 $ US |
| 1994 | 51 897 983 393 $ US | 257 440 000 000 $ US |
| 1993 | 46 578 631 453 $ US | 236 741 715 015 $ US |
| 1992 | 41 855 986 519 $ US | 228 778 917 308 $ US |
| 1991 | 37 387 836 491 $ US | 189 719 984 268 $ US |
| 1990 | 42 978 914 311 $ US | 141 352 654 305 $ US |
| 1989 | 39 756 299 050 $ US | 76 629 728 760 $ US |
| 1988 | 34 980 124 929 $ US | 126 890 235 049 $ US |
| 1987 | 40 455 616 654 $ US | 108 810 885 301 $ US |
| 1986 | 41 253 507 951 $ US | 105 872 372 614 $ US |
| 1985 | 39 053 502 251 $ US | 88 150 891 728 $ US |
| 1984 | 33 971 188 992 $ US | 116 915 052 107 $ US |
| 1983 | 30 966 239 814 $ US | 103 979 106 778 $ US |
| 1982 | 27 655 172 414 $ US | 84 307 486 837 $ US |
| 1981 | 22 136 081 081 $ US | 78 676 842 367 $ US |
| 1980 | 21 669 908 176 $ US | 76 961 923 741 $ US |
| 1979 | 18 020 571 429 $ US | 69 252 328 952 $ US |
| 1978 | 14 811 704 063 $ US | 89 049 453 088 $ US |
| 1977 | 14 400 806 876 $ US | 56 781 000 101 $ US |
| 1976 | 13 315 988 083 $ US | 51 169 499 892 $ US |
| 1975 | 11 632 178 869 $ US | 52 438 647 922 $ US |
| 1974 | 9 228 963 225 $ US | 72 436 777 342 $ US |
| 1973 | 10 098 534 613 $ US | 52 544 000 117 $ US |
| 1972 | 9 299 638 056 $ US | 34 733 000 536 $ US |
| 1971 | 8 609 283 346 $ US | 33 293 199 095 $ US |
| 1970 | 8 042 200 452 $ US | 31 584 210 366 $ US |
| 1969 | 6 524 455 206 $ US | 31 256 284 544 $ US |
| 1968 | 5 932 242 991 $ US | 26 436 857 247 $ US |
| 1967 | 5 605 484 299 $ US | 24 256 667 553 $ US |
| 1966 | 5 278 005 612 $ US | 28 630 474 728 $ US |
| 1965 | 4 948 667 540 $ US | 28 344 705 967 $ US |
| 1964 | 4 709 245 762 $ US | 25 605 249 382 $ US |
| 1963 | 4 187 146 232 $ US | 18 272 123 664 $ US |
| 1962 | 4 035 462 027 $ US | 18 337 691 145 $ US |
| 1961 | 4 494 575 611 $ US | 20 132 220 375 $ US |
| 1960 | 4 206 270 352 $ US | 15 865 474 315 $ US |
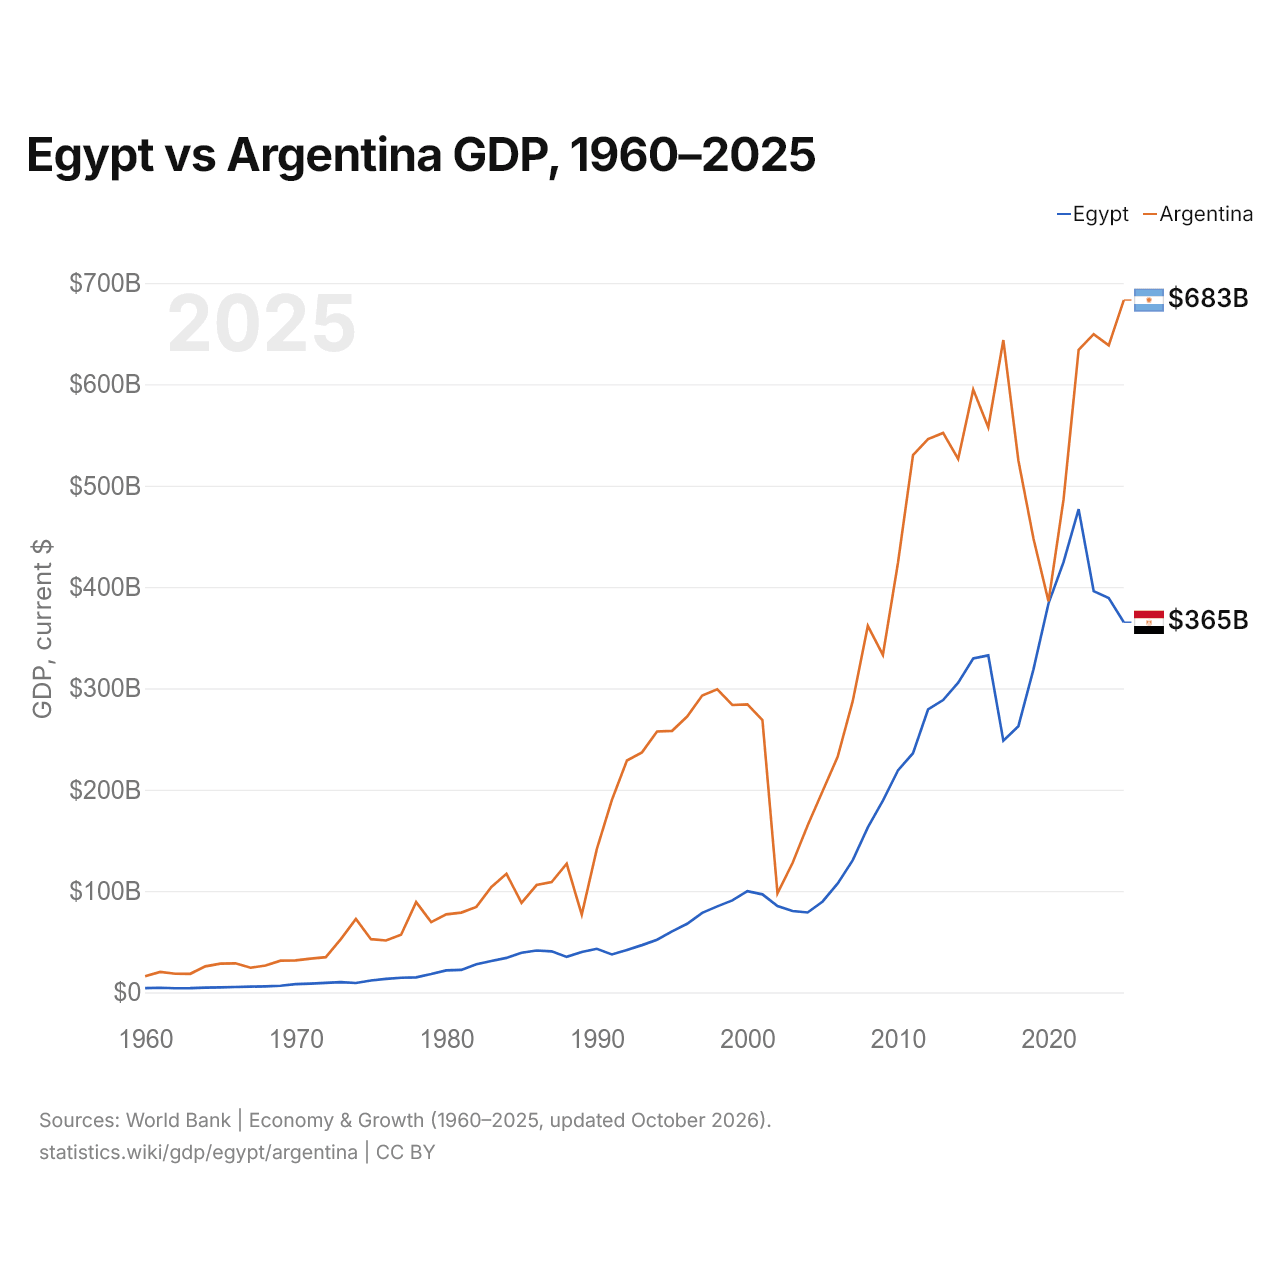
En 2025, le PIB de l'Argentine (683 milliards de dollars US) était 1,9 fois celui de l'Égypte (365 milliards de dollars US). En 2015, le rapport était de 1,8. De 2015 à 2025, à prix constants de 2015, le PIB de l'Argentine a progressé de 2,4 % et celui de l'Égypte de 52,8 %.
Depuis 1960, le PIB de l'Argentine a chaque année été le plus élevé des deux ; en 1960, il était 3,8 fois celui de l'Égypte. En 2025, le PIB par habitant était de 3 086 $ US en Égypte et de 14 898 $ US en Argentine, soit 4,8 fois plus élevé en Argentine. En parité de pouvoir d'achat, l'ordre s'inverse : le PIB (PPA) est de 2,39 billions de dollars en Égypte et de 1,49 billion de dollars en Argentine.
Égypte vs Argentine : derniers chiffres du PIB
|
Égypte
|
Argentine
|
|
|---|---|---|
| PIB, dollars US courants | 365 Md $US | 683 Md $US |
| Rang mondial | 43/197 | 25/197 |
| Part mondiale | 0,31 % | 0,58 % |
| PIB, dollars US constants de 2015 | 503 Md $US | 609 Md $US |
| Écart de PIB | 0,53× | 1,9× |
Comparer le PIB de 2 pays au choix
Sources :
- Banque mondiale | Économie et croissance (1960–2025, mis à jour en octobre 2026)
Creative Commons Attribution (CC BY) : vous pouvez copier, partager, adapter et réutiliser ce contenu, y compris à des fins commerciales, à condition de citer statistics.wiki et d’indiquer les modifications apportées. Les sources citées ci-dessus peuvent avoir leurs propres conditions de licence.