
Arabie saoudite vs Mexique : PIB, 1960–2025
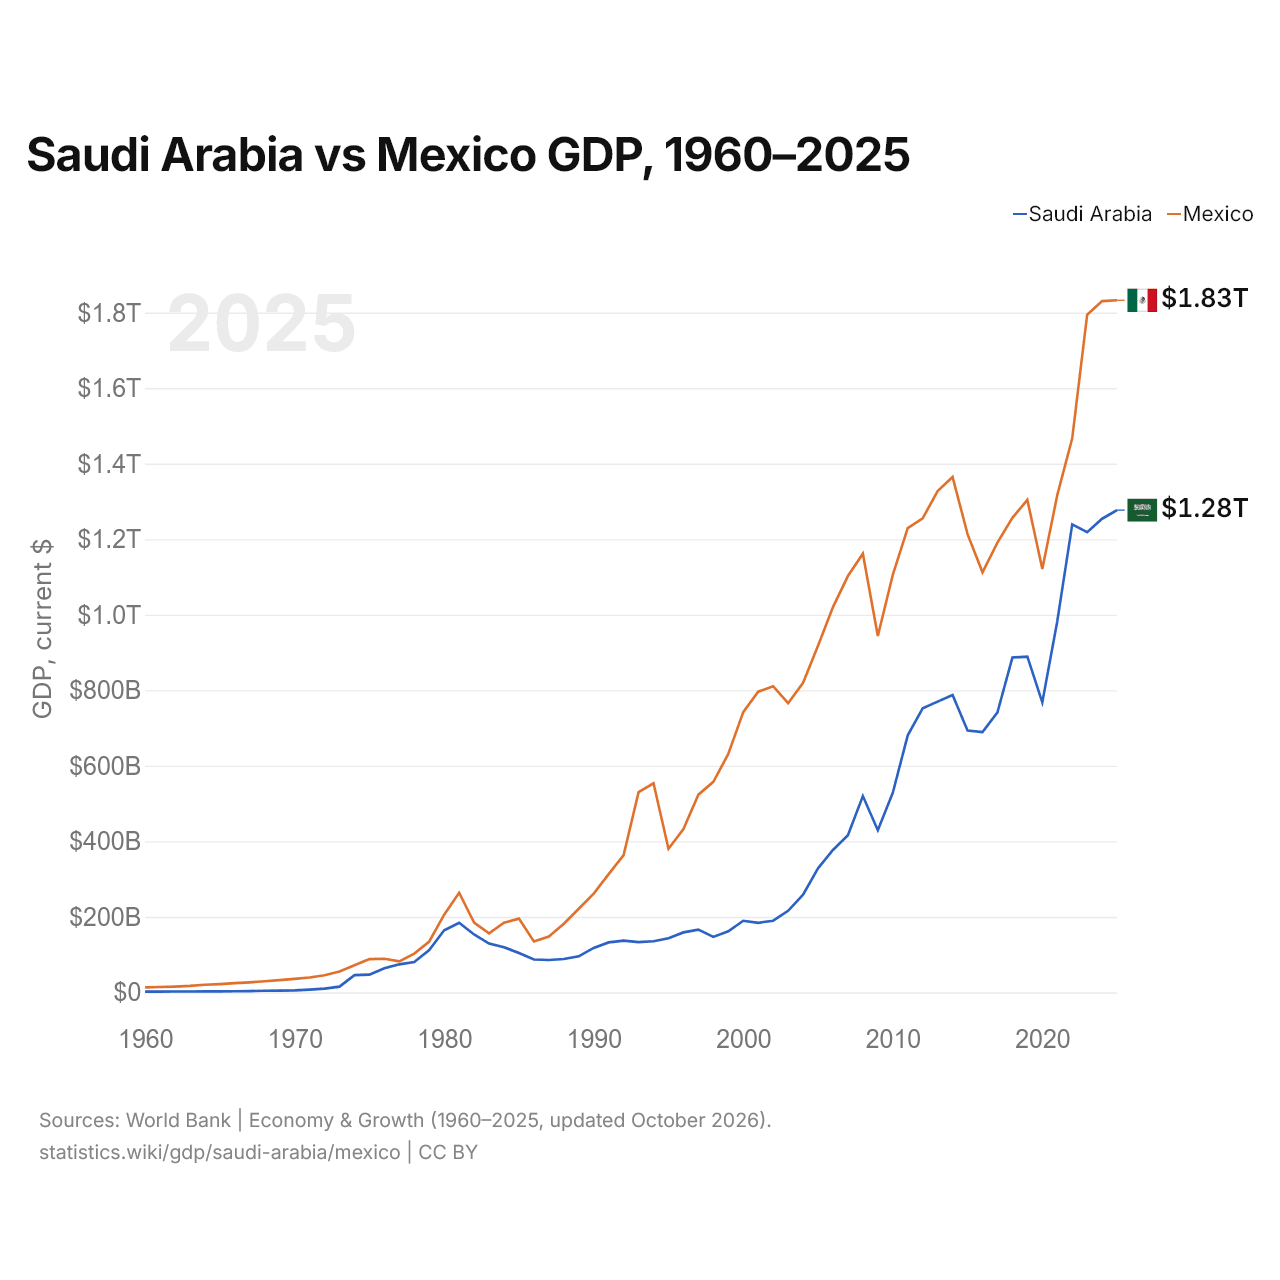
| Année | PIB, dollars US courants | |
|---|---|---|
 Arabie saoudite |
 Mexique |
|
| 2025 | 1 276 942 933 333 $ US | 1 832 641 364 776 $ US |
| 2024 | 1 254 140 800 000 $ US | 1 830 489 311 089 $ US |
| 2023 | 1 218 584 800 000 $ US | 1 794 410 347 718 $ US |
| 2022 | 1 239 075 200 000 $ US | 1 466 934 724 243 $ US |
| 2021 | 982 661 066 667 $ US | 1 316 569 466 834 $ US |
| 2020 | 767 951 200 000 $ US | 1 121 064 767 169 $ US |
| 2019 | 888 890 133 333 $ US | 1 304 106 204 006 $ US |
| 2018 | 886 564 800 000 $ US | 1 256 300 182 984 $ US |
| 2017 | 741 266 133 333 $ US | 1 190 721 475 853 $ US |
| 2016 | 689 279 466 667 $ US | 1 112 233 497 453 $ US |
| 2015 | 693 414 400 000 $ US | 1 213 294 467 654 $ US |
| 2014 | 787 153 066 667 $ US | 1 364 507 717 689 $ US |
| 2013 | 769 755 733 333 $ US | 1 327 436 290 439 $ US |
| 2012 | 751 921 333 333 $ US | 1 255 110 424 742 $ US |
| 2011 | 680 660 800 000 $ US | 1 229 013 703 417 $ US |
| 2010 | 528 207 466 667 $ US | 1 105 424 238 652 $ US |
| 2009 | 429 097 866 667 $ US | 943 437 414 951 $ US |
| 2008 | 519 796 800 000 $ US | 1 161 553 459 985 $ US |
| 2007 | 415 964 509 673 $ US | 1 102 355 554 880 $ US |
| 2006 | 376 900 133 511 $ US | 1 020 265 057 882 $ US |
| 2005 | 328 459 608 764 $ US | 917 571 853 437 $ US |
| 2004 | 258 742 133 333 $ US | 819 459 227 375 $ US |
| 2003 | 215 807 733 333 $ US | 765 549 967 889 $ US |
| 2002 | 189 605 866 667 $ US | 810 666 116 402 $ US |
| 2001 | 184 137 600 000 $ US | 796 064 590 549 $ US |
| 2000 | 189 514 933 333 $ US | 742 061 329 749 $ US |
| 1999 | 161 717 066 667 $ US | 631 249 359 702 $ US |
| 1998 | 146 775 466 667 $ US | 557 461 102 631 $ US |
| 1997 | 165 963 684 913 $ US | 523 449 530 464 $ US |
| 1996 | 158 662 483 311 $ US | 432 157 945 024 $ US |
| 1995 | 143 343 124 166 $ US | 380 157 469 867 $ US |
| 1994 | 135 174 899 866 $ US | 553 618 247 901 $ US |
| 1993 | 132 967 957 276 $ US | 530 160 763 663 $ US |
| 1992 | 137 087 850 467 $ US | 363 157 832 924 $ US |
| 1991 | 132 223 230 975 $ US | 313 139 656 146 $ US |
| 1990 | 117 630 173 565 $ US | 261 253 675 693 $ US |
| 1989 | 95 344 459 279 $ US | 221 403 098 267 $ US |
| 1988 | 88 256 074 766 $ US | 181 611 150 497 $ US |
| 1987 | 85 695 861 148 $ US | 147 542 558 209 $ US |
| 1986 | 86 961 922 765 $ US | 134 556 034 673 $ US |
| 1985 | 103 897 846 494 $ US | 195 241 069 482 $ US |
| 1984 | 119 624 858 116 $ US | 184 230 754 105 $ US |
| 1983 | 129 171 635 311 $ US | 156 167 000 433 $ US |
| 1982 | 153 240 313 858 $ US | 184 602 611 610 $ US |
| 1981 | 184 291 360 139 $ US | 263 797 827 860 $ US |
| 1980 | 164 539 660 725 $ US | 205 577 055 466 $ US |
| 1979 | 111 858 444 786 $ US | 134 531 900 899 $ US |
| 1978 | 80 266 516 687 $ US | 102 648 570 299 $ US |
| 1977 | 74 188 986 586 $ US | 81 912 018 784 $ US |
| 1976 | 64 005 665 722 $ US | 88 875 923 765 $ US |
| 1975 | 46 773 208 643 $ US | 88 000 000 000 $ US |
| 1974 | 45 412 957 746 $ US | 72 000 000 000 $ US |
| 1973 | 14 947 435 499 $ US | 55 280 000 000 $ US |
| 1972 | 9 664 267 087 $ US | 45 200 000 000 $ US |
| 1971 | 7 184 806 909 $ US | 39 200 000 000 $ US |
| 1970 | 5 377 333 333 $ US | 35 520 000 000 $ US |
| 1969 | 4 485 777 644 $ US | 32 480 000 000 $ US |
| 1968 | 4 187 777 711 $ US | 29 360 000 000 $ US |
| 1967 | 3 257 022 223 $ US | 26 560 000 000 $ US |
| 1966 | 2 920 555 557 $ US | 24 320 000 000 $ US |
| 1965 | 2 647 955 558 $ US | 21 840 000 000 $ US |
| 1964 | 2 371 808 713 $ US | 20 080 000 000 $ US |
| 1963 | 2 207 393 172 $ US | 16 960 000 000 $ US |
| 1962 | 2 130 606 532 $ US | 15 200 000 000 $ US |
| 1961 | 1 920 811 284 $ US | 14 160 000 000 $ US |
| 1960 | 1 748 124 064 $ US | 13 040 000 000 $ US |
En 2025, le PIB du Mexique (1,83 billion de dollars US) était supérieur de 44 % à celui de l'Arabie saoudite (1,28 billion de dollars US). En 2015, le rapport était de 1,7. De 2015 à 2025, à prix constants de 2015, le PIB du Mexique a progressé de 11,5 % et celui de l'Arabie saoudite de 33,7 %.
Depuis 1960, le PIB du Mexique a chaque année été le plus élevé des deux ; en 1960, il était 7,5 fois celui de l'Arabie saoudite. En 2025, le PIB par habitant était de 34 537 $ US en Arabie saoudite et de 13 889 $ US au Mexique, soit 2,5 fois plus élevé en Arabie saoudite.
Arabie saoudite vs Mexique : derniers chiffres du PIB
|
Arabie saoudite
|
Mexique
|
|
|---|---|---|
| PIB, dollars US courants | 1,28 Bn $US | 1,83 Bn $US |
| Rang mondial | 19/197 | 14/197 |
| Part mondiale | 1,08 % | 1,55 % |
| PIB, dollars US constants de 2015 | 927 Md $US | 1,35 Bn $US |
| Écart de PIB | 0,7× | 1,4× |
Comparer le PIB de 2 pays au choix
Sources :
- Banque mondiale | Économie et croissance (1960–2025, mis à jour en octobre 2026)
Creative Commons Attribution (CC BY) : vous pouvez copier, partager, adapter et réutiliser ce contenu, y compris à des fins commerciales, à condition de citer statistics.wiki et d’indiquer les modifications apportées. Les sources citées ci-dessus peuvent avoir leurs propres conditions de licence.