
España vs Mauricio: gasto militar (US$), 1960–2025
| Año | US$ | |
|---|---|---|
 España |
 Mauricio |
|
| 2025 | 40.586.887.508 US$ | 23.515.490 US$ |
| 2024 | 25.200.122.783 US$ | 18.861.838 US$ |
| 2023 | 24.857.846.735 US$ | 23.522.037 US$ |
| 2022 | 20.747.343.286 US$ | 17.942.678 US$ |
| 2021 | 19.972.805.515 US$ | 19.917.530 US$ |
| 2020 | 17.486.085.827 US$ | 18.692.611 US$ |
| 2019 | 17.187.851.886 US$ | 21.791.632 US$ |
| 2018 | 17.832.897.289 US$ | 23.391.387 US$ |
| 2017 | 16.153.299.846 US$ | 22.982.242 US$ |
| 2016 | 14.027.196.491 US$ | 22.287.892 US$ |
| 2015 | 15.193.969.093 US$ | 17.307.060 US$ |
| 2014 | 17.201.428.155 US$ | 19.980.353 US$ |
| 2013 | 17.247.857.259 US$ | 23.468.217 US$ |
| 2012 | 18.859.554.242 US$ | 16.895.896 US$ |
| 2011 | 19.721.235.943 US$ | 17.754.249 US$ |
| 2010 | 19.730.018.063 US$ | 15.084.137 US$ |
| 2009 | 20.328.954.964 US$ | 15.543.687 US$ |
| 2008 | 22.375.850.012 US$ | 15.794.423 US$ |
| 2007 | 20.129.621.716 US$ | 11.814.029 US$ |
| 2006 | 17.287.393.714 US$ | 10.981.832 US$ |
| 2005 | 16.017.291.406 US$ | 10.566.100 US$ |
| 2004 | 15.300.926.415 US$ | 11.082.373 US$ |
| 2003 | 12.916.179.835 US$ | 11.029.473 US$ |
| 2002 | 10.321.954.149 US$ | 9.629.978 US$ |
| 2001 | 10.230.507.087 US$ | 9.098.104 US$ |
| 2000 | 10.320.372.348 US$ | 9.486.189 US$ |
| 1999 | 11.135.118.793 US$ | 9.162.517 US$ |
| 1998 | 10.873.091.809 US$ | 8.570.577 US$ |
| 1997 | 10.160.129.272 US$ | 9.933.735 US$ |
| 1996 | 11.653.260.202 US$ | 13.148.251 US$ |
| 1995 | 11.773.776.493 US$ | 13.628.349 US$ |
| 1994 | 10.610.763.722 US$ | 12.013.398 US$ |
| 1993 | 10.556.302.524 US$ | 10.922.504 US$ |
| 1992 | 12.879.169.417 US$ | 11.581.437 US$ |
| 1991 | 12.280.199.281 US$ | 10.638.164 US$ |
| 1990 | 12.296.136.691 US$ | 9.307.240 US$ |
| 1989 | 9.779.928.333 US$ | 6.413.166 US$ |
| 1988 | 9.357.355.244 US$ | 4.751.417 US$ |
| 1987 | 8.328.351.259 US$ | 3.698.712 US$ |
| 1986 | 6.592.557.942 US$ | 2.935.100 US$ |
| 1985 | 5.338.127.968 US$ | 2.395.433 US$ |
| 1984 | 5.100.935.591 US$ | 2.658.443 US$ |
| 1983 | 5.016.007.812 US$ | 2.973.851 US$ |
| 1982 | 5.210.390.412 US$ | 2.866.303 US$ |
| 1981 | 5.232.979.664 US$ | 5.403.831 US$ |
| 1980 | 5.791.511.464 US$ | 5.611.825 US$ |
| 1979 | 5.354.922.378 US$ | 2.514.338 US$ |
| 1978 | 3.784.167.057 US$ | 1.775.909 US$ |
| 1977 | 3.062.994.910 US$ | 1.441.822 US$ |
| 1976 | 2.748.642.597 US$ | 1.334.798 US$ |
| 1975 | 2.298.789.789 US$ | 1.291.039 US$ |
| 1974 | 2.145.851.987 US$ | 937.352 US$ |
| 1973 | 1.658.691.668 US$ | 764.039 US$ |
| 1972 | 1.369.581.522 US$ | 645.341 US$ |
| 1971 | 982.022.242 US$ | 563.081 US$ |
| 1970 | 936.682.959 US$ | 491.879 US$ |
| 1969 | 902.849.517 US$ | 399.909 US$ |
| 1968 | 744.315.537 US$ | 321.840 US$ |
| 1967 | 603.199.144 US$ | 371.562 US$ |
| 1966 | 614.723.758 US$ | 376.729 US$ |
| 1965 | 480.256.897 US$ | 375.473 US$ |
| 1964 | 424.083.408 US$ | 374.000 US$ |
| 1963 | 386.672.717 US$ | 359.066 US$ |
| 1962 | 376.664.265 US$ | - |
| 1961 | 289.211.213 US$ | - |
| 1960 | 279.644.379 US$ | - |
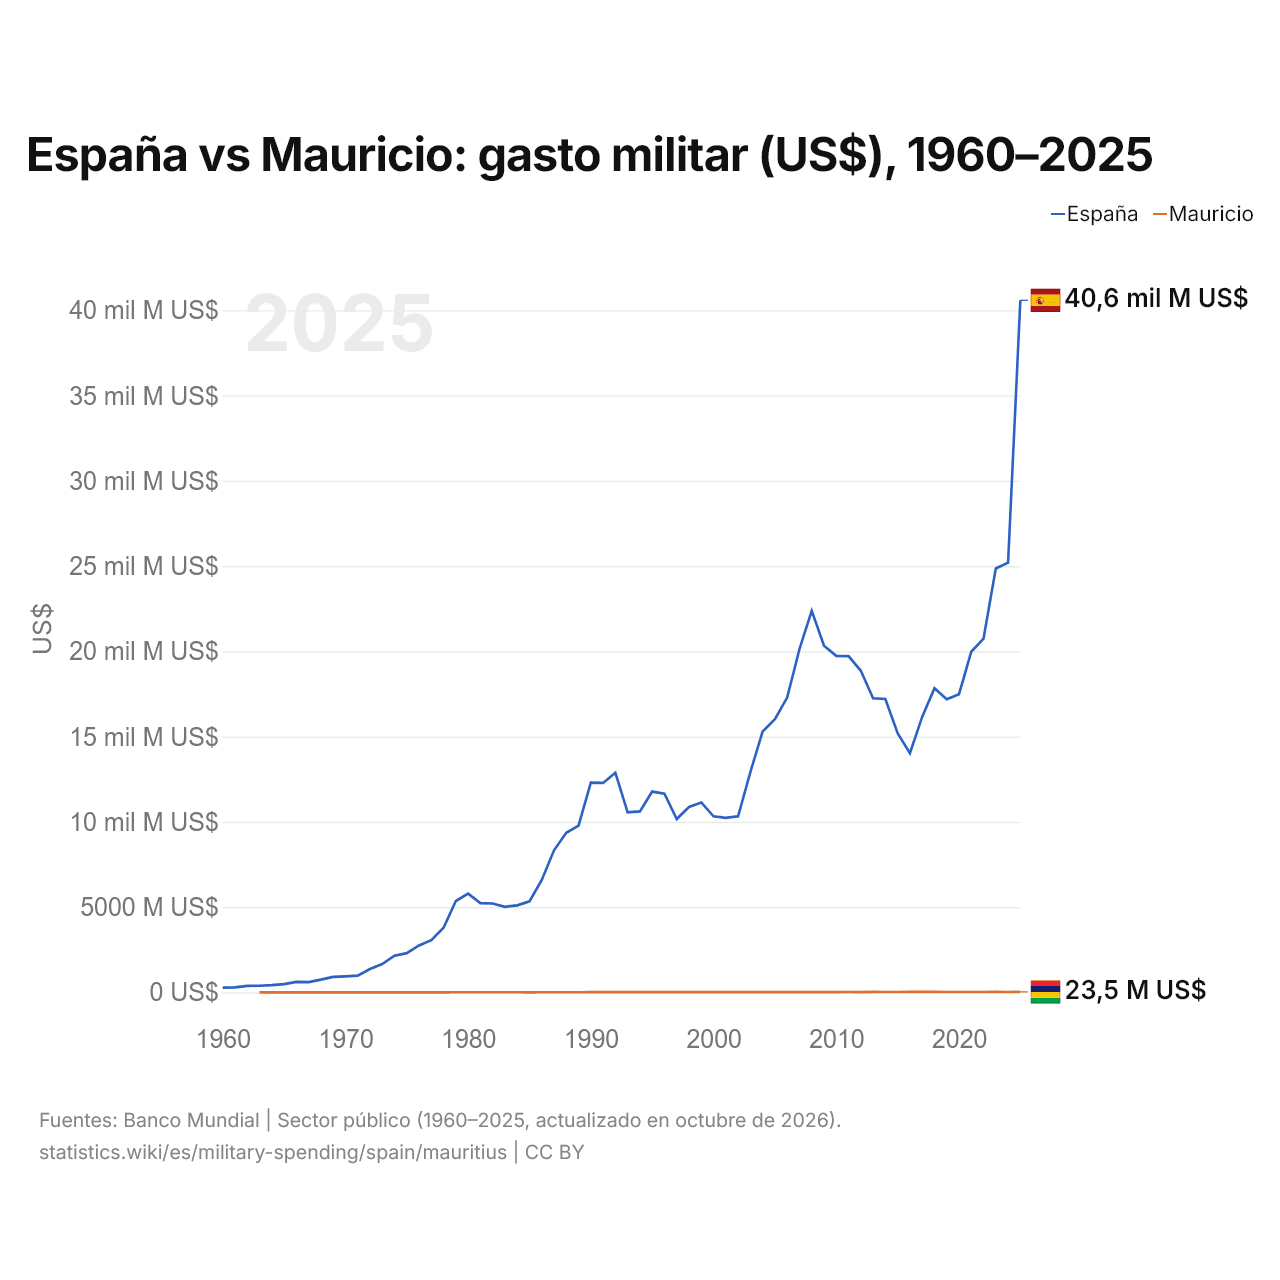
En 2025, el gasto militar fue de 40,6 mil millones de US$ en España y de 23,5 millones de US$ en Mauricio: 1700 veces más en España. En 1963 fue de 387 millones de US$ en España y de 359.000 US$ en Mauricio, 1100 veces más en España.
España vs Mauricio: gasto militar en % del PIB, 1960–2025
| Año | % del PIB | |
|---|---|---|
|
España
|
Mauricio
|
|
| 2025 | 2,1 % | 0,1 % |
| 2024 | 1,5 % | 0,1 % |
| 2023 | 1,5 % | 0,2 % |
| 2022 | 1,4 % | 0,1 % |
| 2021 | 1,4 % | 0,2 % |
| 2020 | 1,4 % | 0,2 % |
| 2019 | 1,2 % | 0,1 % |
| 2018 | 1,2 % | 0,2 % |
| 2017 | 1,2 % | 0,2 % |
| 2016 | 1,1 % | 0,2 % |
| 2015 | 1,3 % | 0,1 % |
| 2014 | 1,2 % | 0,2 % |
| 2013 | 1,3 % | 0,2 % |
| 2012 | 1,4 % | 0,1 % |
| 2011 | 1,3 % | 0,2 % |
| 2010 | 1,4 % | 0,1 % |
| 2009 | 1,4 % | 0,2 % |
| 2008 | 1,4 % | 0,2 % |
| 2007 | 1,4 % | 0,1 % |
| 2006 | 1,4 % | 0,2 % |
| 2005 | 1,4 % | 0,2 % |
| 2004 | 1,4 % | 0,2 % |
| 2003 | 1,4 % | 0,2 % |
| 2002 | 1,5 % | 0,2 % |
| 2001 | 1,6 % | 0,2 % |
| 2000 | 1,7 % | 0,2 % |
| 1999 | 1,8 % | 0,2 % |
| 1998 | 1,8 % | 0,2 % |
| 1997 | 1,7 % | 0,2 % |
| 1996 | 1,8 % | 0,3 % |
| 1995 | 1,9 % | 0,3 % |
| 1994 | 2 % | 0,3 % |
| 1993 | 2 % | 0,3 % |
| 1992 | 2 % | 0,4 % |
| 1991 | 2,1 % | 0,4 % |
| 1990 | 2,3 % | 0,3 % |
| 1989 | 2,4 % | 0,3 % |
| 1988 | 2,5 % | 0,2 % |
| 1987 | 2,6 % | 0,2 % |
| 1986 | 2,6 % | 0,2 % |
| 1985 | 3 % | 0,2 % |
| 1984 | 3 % | 0,3 % |
| 1983 | 2,9 % | 0,3 % |
| 1982 | 2,7 % | 0,3 % |
| 1981 | 2,6 % | 0,5 % |
| 1980 | 2,5 % | 0,5 % |
| 1979 | 2,5 % | 0,2 % |
| 1978 | 2,4 % | 0,2 % |
| 1977 | 2,3 % | 0,2 % |
| 1976 | 2,3 % | 0,2 % |
| 1975 | 2 % | 0,2 % |
| 1974 | 2,2 % | 0,1 % |
| 1973 | 2,1 % | 0,2 % |
| 1972 | 2,3 % | 0,2 % |
| 1971 | 2,1 % | 0,2 % |
| 1970 | 2,3 % | 0,2 % |
| 1969 | 2,4 % | 0,2 % |
| 1968 | 2,3 % | 0,2 % |
| 1967 | 1,9 % | 0,2 % |
| 1966 | 2,1 % | 0,2 % |
| 1965 | 1,9 % | 0,2 % |
| 1964 | 1,9 % | 0,2 % |
| 1963 | 2 % | 0,1 % |
| 1962 | 2,3 % | - |
| 1961 | 2 % | - |
| 1960 | 2,3 % | - |
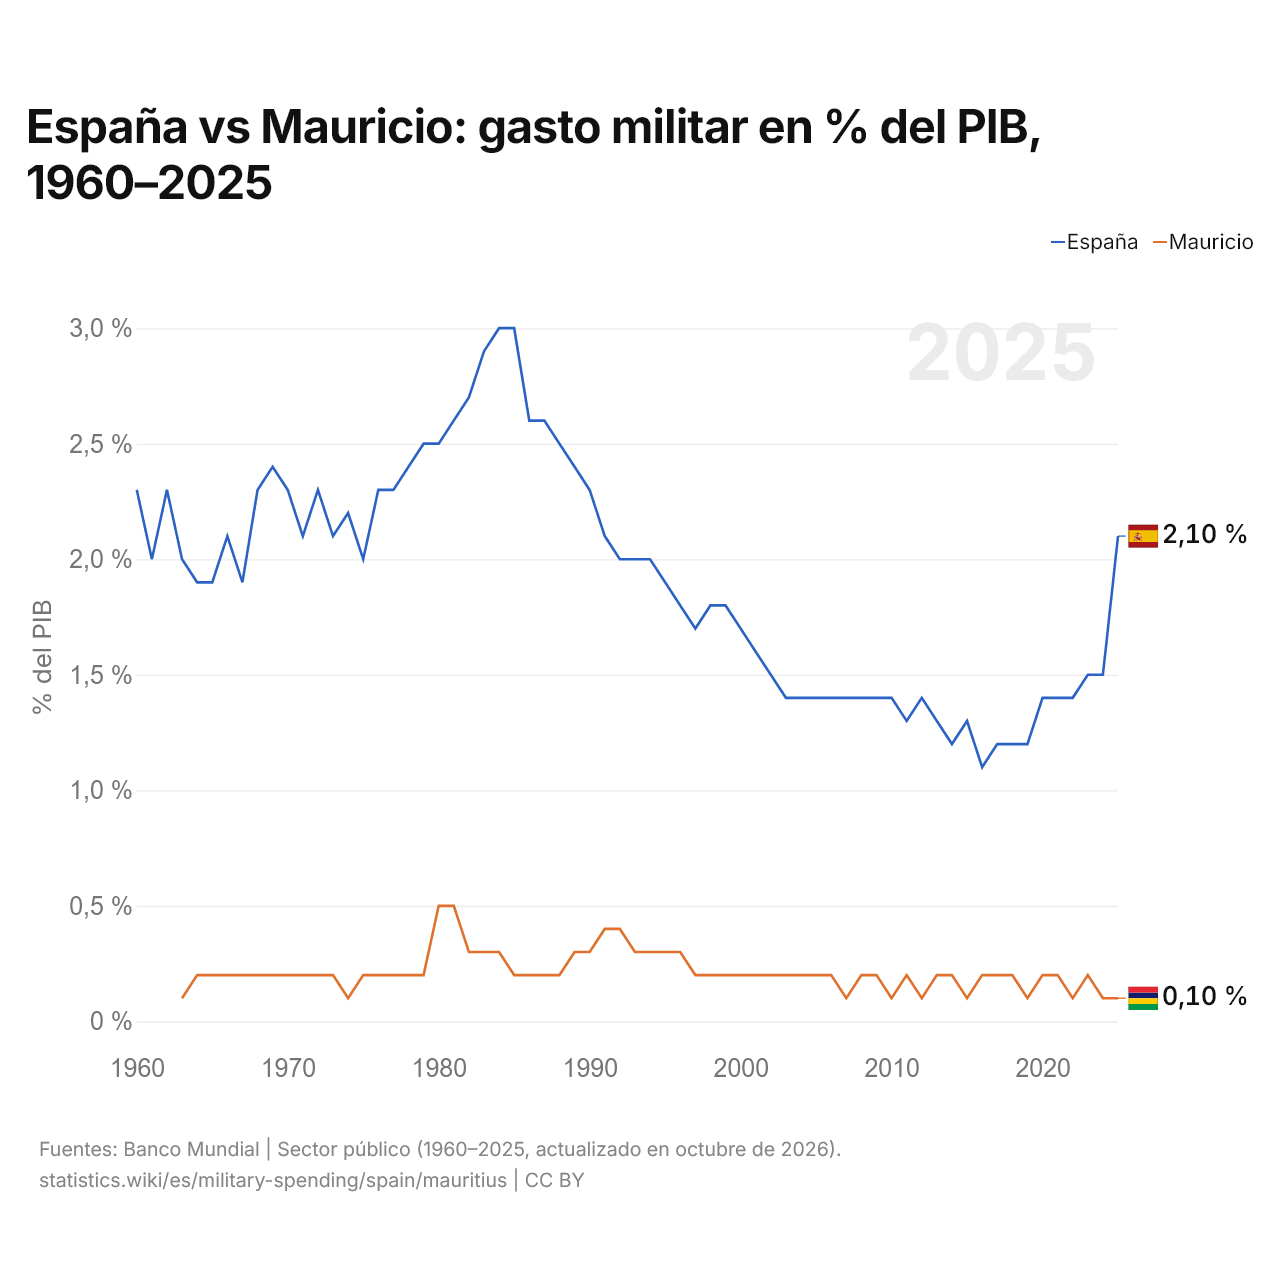
En 2025, el gasto militar fue del 2,1 % del PIB en España y del 0,1 % en Mauricio: 2,0 puntos porcentuales más en España. En 2015 fue del 1,3 % en España y del 0,1 % en Mauricio, 1,2 puntos porcentuales más en España.
El gasto militar de España, como porcentaje del PIB, ha sido más alto que el de Mauricio todos los años desde 1963. La diferencia fue máxima en 1985, cuando el gasto militar de España superó al de Mauricio en 2,8 puntos porcentuales del PIB.
España vs Mauricio: datos del gasto militar
|
España
|
Mauricio
|
|
|---|---|---|
| US$, 2025 | 40,6 mil M US$ | 23,5 M US$ |
| % del PIB, 2025 | 2,1 % | 0,1 % |
| Por persona, US$ | 822 US$ | 18,9 US$ |
| Porcentaje del mundo | 1,42 % | <0,001 % |
| Puesto mundial | 15/154 | 149/154 |
Comparar el gasto militar de 2 países cualesquiera
Fuentes:
- Banco Mundial | Sector público (1960–2025, actualizado en octubre de 2026)
Creative Commons Atribución (CC BY): puedes copiar, compartir, adaptar y reutilizar este contenido, también con fines comerciales, siempre que cites a statistics.wiki e indiques los cambios que hayas hecho. Las fuentes indicadas arriba pueden tener sus propias condiciones de licencia.