
España vs Austria: gasto militar (US$), 1960–2025
| Año | US$ | |
|---|---|---|
 España |
 Austria |
|
| 2025 | 40.586.887.508 US$ | 6.377.841.255 US$ |
| 2024 | 25.200.122.783 US$ | 5.297.170.013 US$ |
| 2023 | 24.857.846.735 US$ | 4.455.908.013 US$ |
| 2022 | 20.747.343.286 US$ | 3.617.116.770 US$ |
| 2021 | 19.972.805.515 US$ | 4.196.948.098 US$ |
| 2020 | 17.486.085.827 US$ | 3.847.944.473 US$ |
| 2019 | 17.187.851.886 US$ | 3.336.257.934 US$ |
| 2018 | 17.832.897.289 US$ | 3.389.811.828 US$ |
| 2017 | 16.153.299.846 US$ | 3.159.831.218 US$ |
| 2016 | 14.027.196.491 US$ | 2.888.574.360 US$ |
| 2015 | 15.193.969.093 US$ | 2.666.603.280 US$ |
| 2014 | 17.201.428.155 US$ | 3.309.561.153 US$ |
| 2013 | 17.247.857.259 US$ | 3.229.983.072 US$ |
| 2012 | 18.859.554.242 US$ | 3.187.046.775 US$ |
| 2011 | 19.721.235.943 US$ | 3.414.187.842 US$ |
| 2010 | 19.730.018.063 US$ | 3.221.491.501 US$ |
| 2009 | 20.328.954.964 US$ | 3.348.175.209 US$ |
| 2008 | 22.375.850.012 US$ | 3.761.898.342 US$ |
| 2007 | 20.129.621.716 US$ | 3.504.449.392 US$ |
| 2006 | 17.287.393.714 US$ | 2.642.533.286 US$ |
| 2005 | 16.017.291.406 US$ | 2.687.234.993 US$ |
| 2004 | 15.300.926.415 US$ | 2.684.092.420 US$ |
| 2003 | 12.916.179.835 US$ | 2.387.314.003 US$ |
| 2002 | 10.321.954.149 US$ | 1.890.627.386 US$ |
| 2001 | 10.230.507.087 US$ | 1.790.363.427 US$ |
| 2000 | 10.320.372.348 US$ | 1.930.350.230 US$ |
| 1999 | 11.135.118.793 US$ | 2.121.466.394 US$ |
| 1998 | 10.873.091.809 US$ | 2.209.911.276 US$ |
| 1997 | 10.160.129.272 US$ | 2.215.560.384 US$ |
| 1996 | 11.653.260.202 US$ | 2.476.754.080 US$ |
| 1995 | 11.773.776.493 US$ | 2.576.767.582 US$ |
| 1994 | 10.610.763.722 US$ | 2.218.872.531 US$ |
| 1993 | 10.556.302.524 US$ | 2.115.527.916 US$ |
| 1992 | 12.879.169.417 US$ | 2.135.927.183 US$ |
| 1991 | 12.280.199.281 US$ | 1.998.105.070 US$ |
| 1990 | 12.296.136.691 US$ | 1.982.540.697 US$ |
| 1989 | 9.779.928.333 US$ | 1.636.297.498 US$ |
| 1988 | 9.357.355.244 US$ | 1.725.535.040 US$ |
| 1987 | 8.328.351.259 US$ | 1.752.176.865 US$ |
| 1986 | 6.592.557.942 US$ | 1.488.363.961 US$ |
| 1985 | 5.338.127.968 US$ | 1.045.449.718 US$ |
| 1984 | 5.100.935.591 US$ | 957.654.672 US$ |
| 1983 | 5.016.007.812 US$ | 999.400.283 US$ |
| 1982 | 5.210.390.412 US$ | 1.003.172.741 US$ |
| 1981 | 5.232.979.664 US$ | 976.469.364 US$ |
| 1980 | 5.791.511.464 US$ | 1.160.873.638 US$ |
| 1979 | 5.354.922.378 US$ | 1.055.994.321 US$ |
| 1978 | 3.784.167.057 US$ | 883.385.007 US$ |
| 1977 | 3.062.994.910 US$ | 691.063.674 US$ |
| 1976 | 2.748.642.597 US$ | 584.191.025 US$ |
| 1975 | 2.298.789.789 US$ | 579.093.457 US$ |
| 1974 | 2.145.851.987 US$ | 447.566.076 US$ |
| 1973 | 1.658.691.668 US$ | 348.384.983 US$ |
| 1972 | 1.369.581.522 US$ | 264.180.949 US$ |
| 1971 | 982.022.242 US$ | 221.664.193 US$ |
| 1970 | 936.682.959 US$ | 211.336.451 US$ |
| 1969 | 902.849.517 US$ | 204.610.678 US$ |
| 1968 | 744.315.537 US$ | 192.832.244 US$ |
| 1967 | 603.199.144 US$ | 187.219.585 US$ |
| 1966 | 614.723.758 US$ | 177.702.225 US$ |
| 1965 | 480.256.897 US$ | 151.349.235 US$ |
| 1964 | 424.083.408 US$ | 173.889.213 US$ |
| 1963 | 386.672.717 US$ | 132.914.045 US$ |
| 1962 | 376.664.265 US$ | 105.367.535 US$ |
| 1961 | 289.211.213 US$ | 96.191.346 US$ |
| 1960 | 279.644.379 US$ | 96.591.479 US$ |
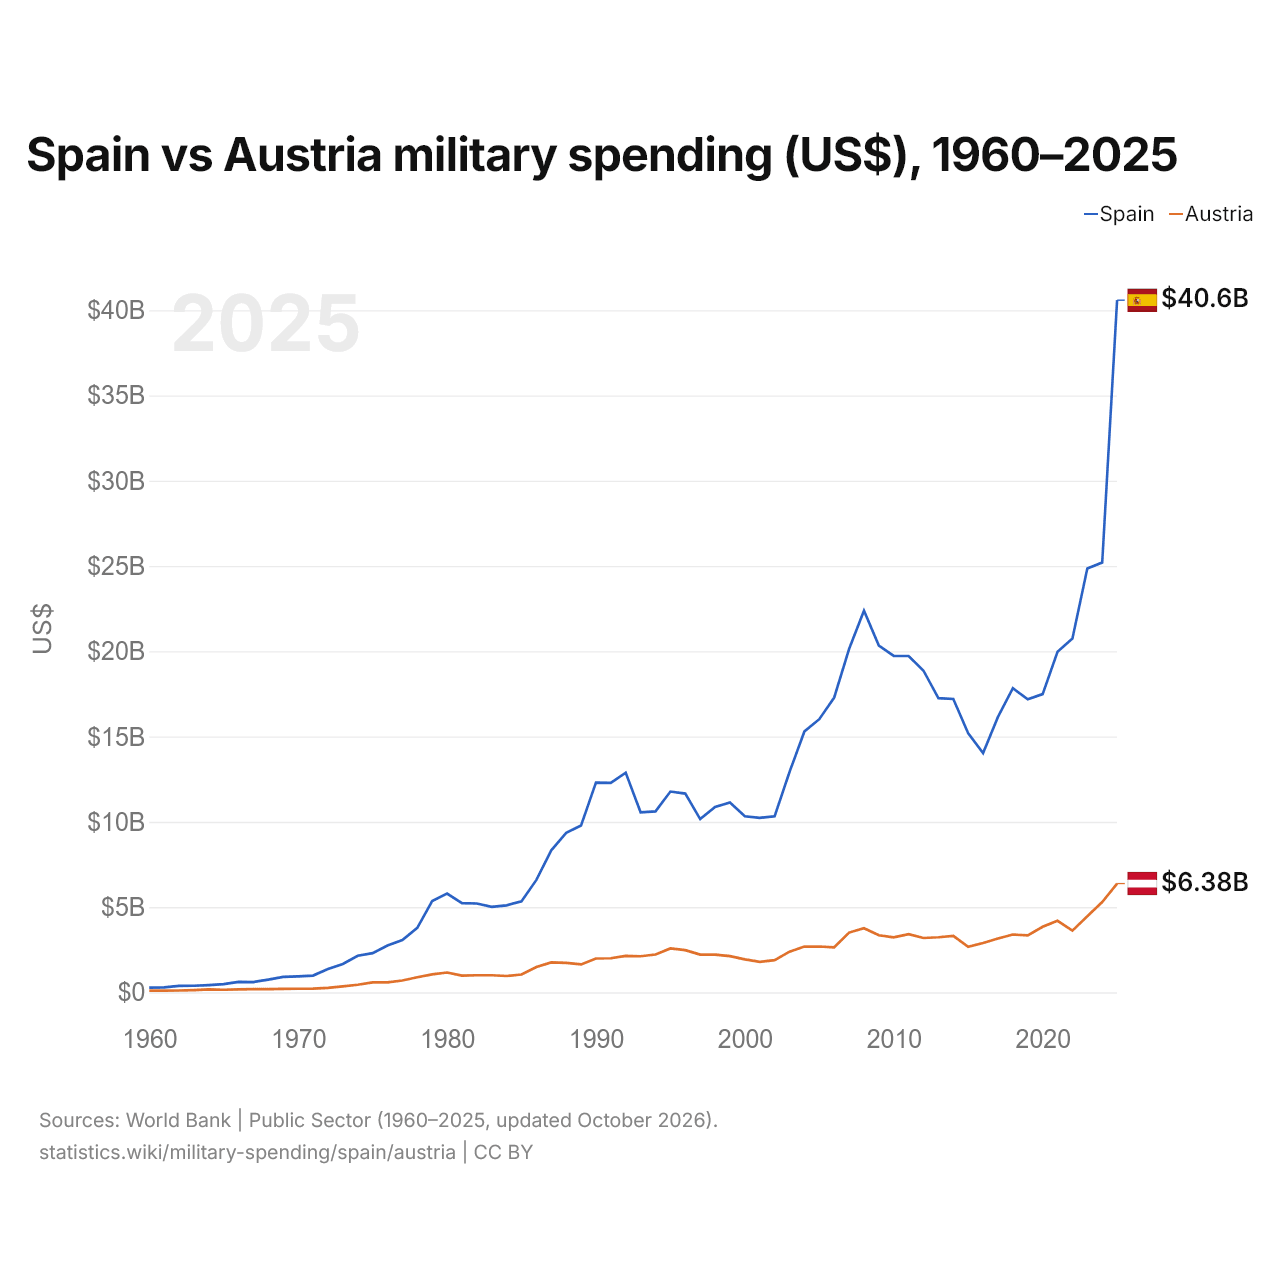
En 2025, el gasto militar fue de 40,6 mil millones de US$ en España y de 6,38 mil millones de US$ en Austria: 6,4 veces más en España. En 1960 fue de 280 millones de US$ en España y de 96,6 millones de US$ en Austria, 2,9 veces más en España.
España vs Austria: gasto militar en % del PIB, 1960–2025
| Año | % del PIB | |
|---|---|---|
|
España
|
Austria
|
|
| 2025 | 2,1 % | 1,1 % |
| 2024 | 1,5 % | 1 % |
| 2023 | 1,5 % | 0,9 % |
| 2022 | 1,4 % | 0,8 % |
| 2021 | 1,4 % | 0,9 % |
| 2020 | 1,4 % | 0,9 % |
| 2019 | 1,2 % | 0,8 % |
| 2018 | 1,2 % | 0,7 % |
| 2017 | 1,2 % | 0,8 % |
| 2016 | 1,1 % | 0,7 % |
| 2015 | 1,3 % | 0,7 % |
| 2014 | 1,2 % | 0,8 % |
| 2013 | 1,3 % | 0,8 % |
| 2012 | 1,4 % | 0,8 % |
| 2011 | 1,3 % | 0,8 % |
| 2010 | 1,4 % | 0,8 % |
| 2009 | 1,4 % | 0,8 % |
| 2008 | 1,4 % | 0,9 % |
| 2007 | 1,4 % | 0,9 % |
| 2006 | 1,4 % | 0,8 % |
| 2005 | 1,4 % | 0,9 % |
| 2004 | 1,4 % | 0,9 % |
| 2003 | 1,4 % | 0,9 % |
| 2002 | 1,5 % | 0,9 % |
| 2001 | 1,6 % | 0,9 % |
| 2000 | 1,7 % | 1 % |
| 1999 | 1,8 % | 1 % |
| 1998 | 1,8 % | 1 % |
| 1997 | 1,7 % | 1 % |
| 1996 | 1,8 % | 1 % |
| 1995 | 1,9 % | 1,1 % |
| 1994 | 2 % | 1,1 % |
| 1993 | 2 % | 1,1 % |
| 1992 | 2 % | 1,1 % |
| 1991 | 2,1 % | 1,2 % |
| 1990 | 2,3 % | 1,2 % |
| 1989 | 2,4 % | 1,2 % |
| 1988 | 2,5 % | 1,3 % |
| 1987 | 2,6 % | 1,4 % |
| 1986 | 2,6 % | 1,5 % |
| 1985 | 3 % | 1,5 % |
| 1984 | 3 % | 1,4 % |
| 1983 | 2,9 % | 1,4 % |
| 1982 | 2,7 % | 1,4 % |
| 1981 | 2,6 % | 1,4 % |
| 1980 | 2,5 % | 1,4 % |
| 1979 | 2,5 % | 1,4 % |
| 1978 | 2,4 % | 1,4 % |
| 1977 | 2,3 % | 1,3 % |
| 1976 | 2,3 % | 1,4 % |
| 1975 | 2 % | 1,5 % |
| 1974 | 2,2 % | 1,3 % |
| 1973 | 2,1 % | 1,2 % |
| 1972 | 2,3 % | 1,2 % |
| 1971 | 2,1 % | 1,2 % |
| 1970 | 2,3 % | 1,4 % |
| 1969 | 2,4 % | 1,5 % |
| 1968 | 2,3 % | 1,5 % |
| 1967 | 1,9 % | 1,6 % |
| 1966 | 2,1 % | 1,6 % |
| 1965 | 1,9 % | 1,5 % |
| 1964 | 1,9 % | 1,9 % |
| 1963 | 2 % | 1,6 % |
| 1962 | 2,3 % | 1,4 % |
| 1961 | 2 % | 1,3 % |
| 1960 | 2,3 % | 1,5 % |
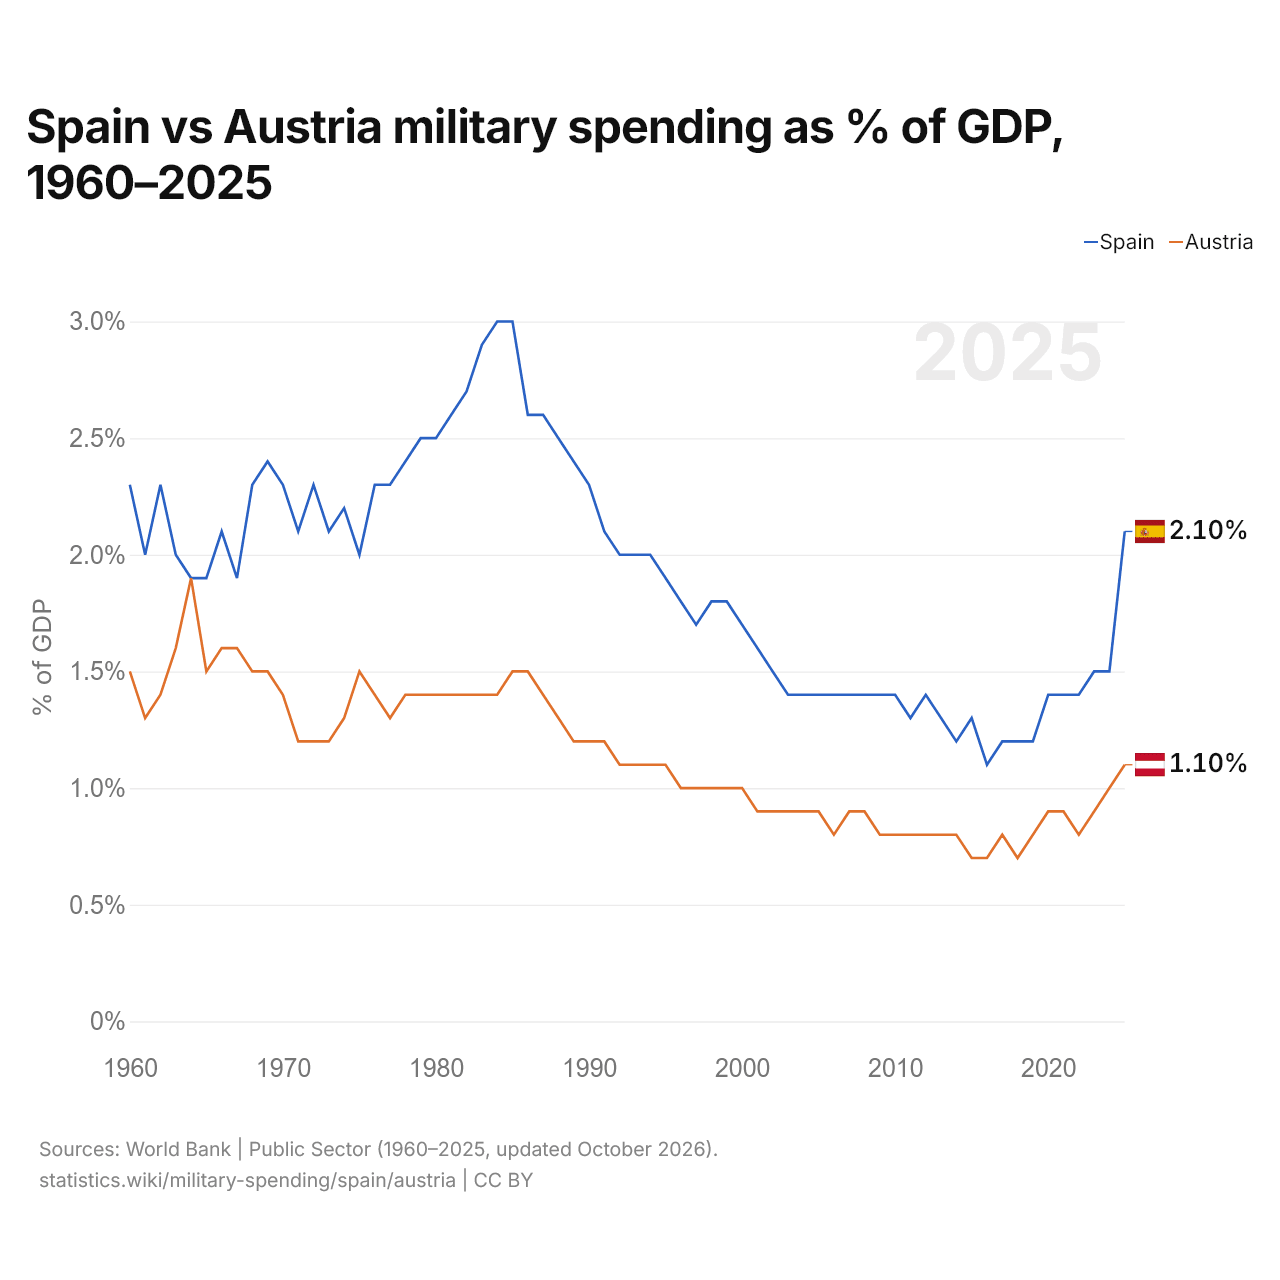
En 2025, el gasto militar fue del 2,1 % del PIB en España y del 1,1 % en Austria: 1,0 puntos porcentuales más en España. En 2015 fue del 1,3 % en España y del 0,7 % en Austria, 0,6 puntos porcentuales más en España.
El gasto militar de España, como porcentaje del PIB, ha sido más alto que el de Austria todos los años desde 1965. La diferencia fue máxima en 1984, cuando el gasto militar de España superó al de Austria en 1,6 puntos porcentuales del PIB.
España vs Austria: datos del gasto militar
|
España
|
Austria
|
|
|---|---|---|
| US$, 2025 | 40,6 mil M US$ | 6380 M US$ |
| % del PIB, 2025 | 2,1 % | 1,1 % |
| Por persona, US$ | 822 US$ | 693 US$ |
| Porcentaje del mundo | 1,42 % | 0,22 % |
| Puesto mundial | 15/154 | 41/154 |
Comparar el gasto militar de 2 países cualesquiera
Fuentes:
- Banco Mundial | Sector público (1960–2025, actualizado en octubre de 2026)
Creative Commons Atribución (CC BY): puedes copiar, compartir, adaptar y reutilizar este contenido, también con fines comerciales, siempre que cites a statistics.wiki e indiques los cambios que hayas hecho. Las fuentes indicadas arriba pueden tener sus propias condiciones de licencia.