
Portugal vs México: gasto militar (US$), 1960–2025
| Año | US$ | |
|---|---|---|
 Portugal |
 México |
|
| 2025 | 5.931.729.151 US$ | 13.503.075.537 US$ |
| 2024 | 4.529.704.001 US$ | 20.594.948.080 US$ |
| 2023 | 3.531.855.845 US$ | 11.845.743.153 US$ |
| 2022 | 3.488.539.557 US$ | 10.057.300.149 US$ |
| 2021 | 3.881.044.054 US$ | 8.681.514.268 US$ |
| 2020 | 3.298.548.143 US$ | 8.045.776.547 US$ |
| 2019 | 3.301.778.119 US$ | 6.642.303.610 US$ |
| 2018 | 3.363.358.444 US$ | 5.836.915.689 US$ |
| 2017 | 3.223.432.269 US$ | 5.058.770.135 US$ |
| 2016 | 3.236.363.321 US$ | 5.339.235.445 US$ |
| 2015 | 3.134.862.102 US$ | 5.468.837.746 US$ |
| 2014 | 3.440.418.481 US$ | 6.758.693.701 US$ |
| 2013 | 3.807.448.795 US$ | 6.473.148.502 US$ |
| 2012 | 3.946.356.885 US$ | 5.717.053.730 US$ |
| 2011 | 3.847.642.710 US$ | 5.498.447.537 US$ |
| 2010 | 3.809.844.557 US$ | 4.789.028.315 US$ |
| 2009 | 3.787.950.101 US$ | 4.514.242.326 US$ |
| 2008 | 3.729.835.869 US$ | 4.334.647.517 US$ |
| 2007 | 3.313.815.899 US$ | 4.223.040.704 US$ |
| 2006 | 3.156.575.442 US$ | 3.035.119.328 US$ |
| 2005 | 3.143.816.118 US$ | 3.123.457.258 US$ |
| 2004 | 2.852.268.012 US$ | 2.854.394.326 US$ |
| 2003 | 2.368.649.861 US$ | 2.960.491.598 US$ |
| 2002 | 1.974.502.384 US$ | 3.172.269.379 US$ |
| 2001 | 1.757.254.567 US$ | 3.229.468.545 US$ |
| 2000 | 1.668.817.718 US$ | 3.031.455.126 US$ |
| 1999 | 1.818.071.791 US$ | 2.652.912.508 US$ |
| 1998 | 1.763.779.417 US$ | 2.263.222.979 US$ |
| 1997 | 1.803.865.596 US$ | 2.184.061.032 US$ |
| 1996 | 1.964.092.952 US$ | 1.882.873.609 US$ |
| 1995 | 2.016.529.150 US$ | 1.562.616.544 US$ |
| 1994 | 1.675.978.156 US$ | 2.635.286.400 US$ |
| 1993 | 1.697.355.931 US$ | 2.122.982.479 US$ |
| 1992 | 1.942.300.007 US$ | 1.704.861.354 US$ |
| 1991 | 1.632.934.517 US$ | 1.363.417.268 US$ |
| 1990 | 1.448.986.877 US$ | 1.131.440.124 US$ |
| 1989 | 1.143.715.092 US$ | 1.145.220.432 US$ |
| 1988 | 1.062.385.978 US$ | 973.699.782 US$ |
| 1987 | 895.866.142 US$ | 856.251.270 US$ |
| 1986 | 742.303.840 US$ | 853.922.821 US$ |
| 1985 | 499.891.677 US$ | 1.320.441.006 US$ |
| 1984 | 469.387.961 US$ | 1.215.589.630 US$ |
| 1983 | 520.080.316 US$ | 816.544.639 US$ |
| 1982 | 621.280.577 US$ | 914.557.183 US$ |
| 1981 | 640.400.558 US$ | 1.354.076.926 US$ |
| 1980 | 666.721.962 US$ | 855.421.305 US$ |
| 1979 | 540.076.076 US$ | 679.786.296 US$ |
| 1978 | 491.803.631 US$ | 518.205.326 US$ |
| 1977 | 443.842.908 US$ | 437.620.043 US$ |
| 1976 | 479.518.714 US$ | 531.570.076 US$ |
| 1975 | 598.829.369 US$ | 504.754.113 US$ |
| 1974 | 760.437.048 US$ | 407.335.779 US$ |
| 1973 | 525.085.622 US$ | 300.843.537 US$ |
| 1972 | 456.425.548 US$ | 242.528.776 US$ |
| 1971 | 398.591.949 US$ | 191.160.988 US$ |
| 1970 | 335.509.119 US$ | 176.680.621 US$ |
| 1969 | 301.633.114 US$ | 194.931.982 US$ |
| 1968 | 299.198.281 US$ | 161.042.760 US$ |
| 1967 | 267.943.783 US$ | 144.809.664 US$ |
| 1966 | 206.904.664 US$ | 140.175.389 US$ |
| 1965 | 186.932.305 US$ | 129.133.333 US$ |
| 1964 | 182.106.546 US$ | 136.043.360 US$ |
| 1963 | 161.564.384 US$ | 121.889.117 US$ |
| 1962 | 162.130.284 US$ | 104.827.586 US$ |
| 1961 | 138.928.393 US$ | 92.292.094 US$ |
| 1960 | 85.337.685 US$ | 87.825.529 US$ |
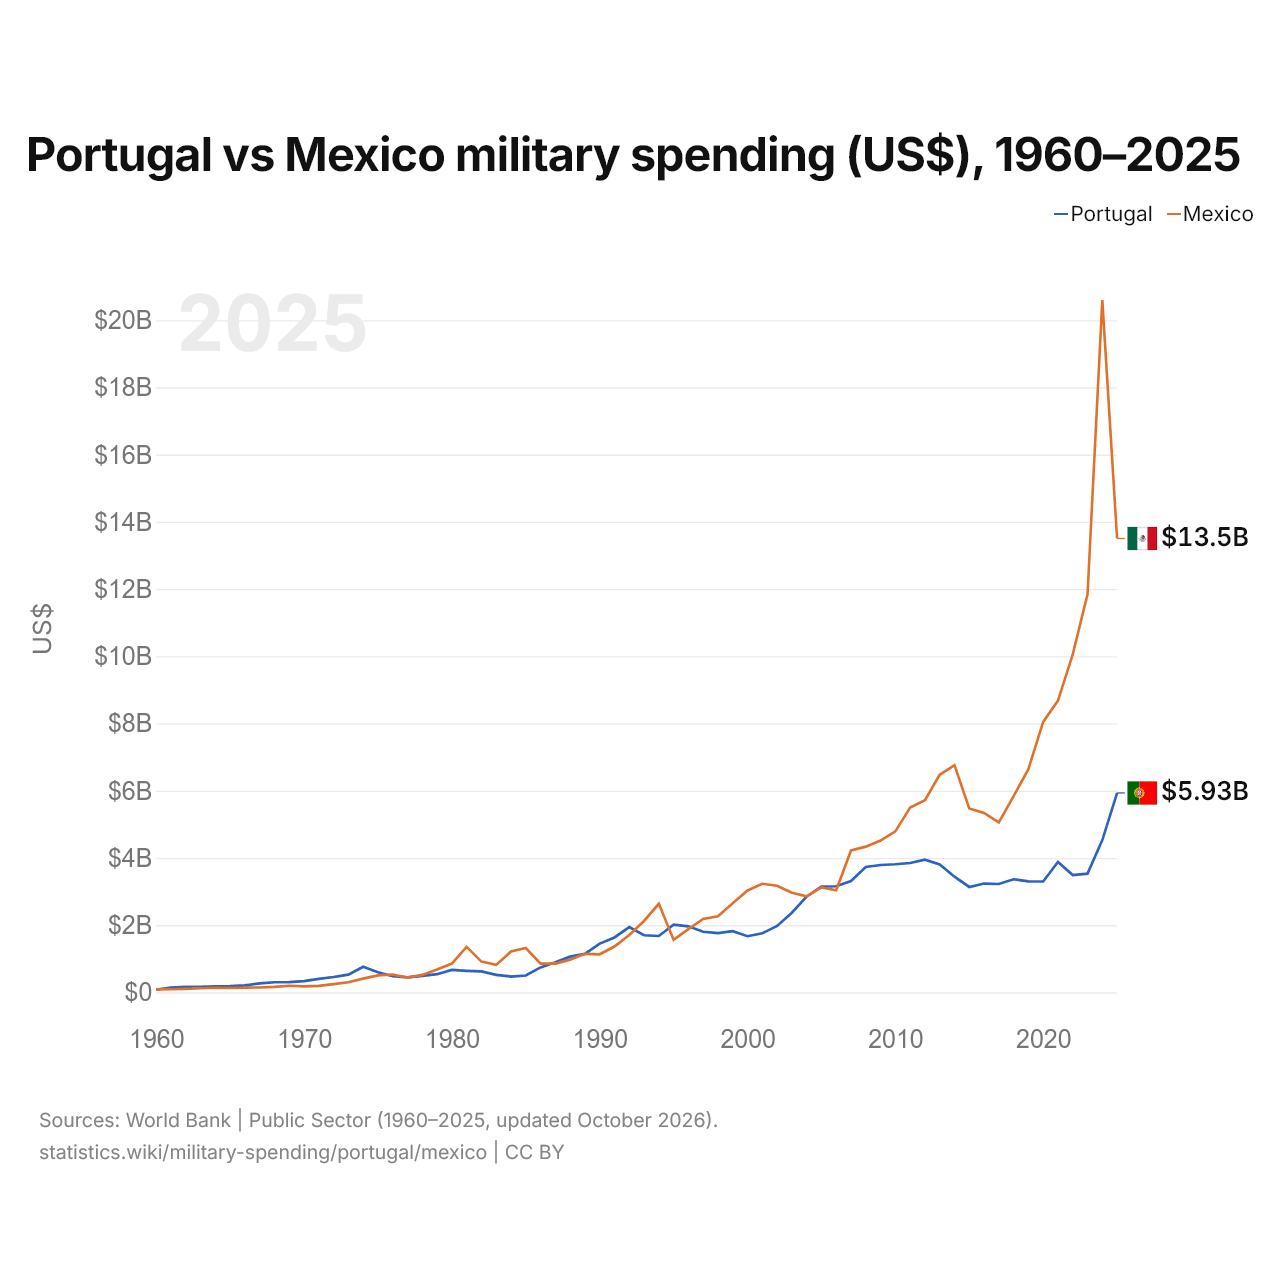
En 2025, el gasto militar fue de 5,93 mil millones de US$ en Portugal y de 13,5 mil millones de US$ en México: 2,3 veces más en México. En 1960 fue de 85,3 millones de US$ en Portugal y de 87,8 millones de US$ en México, un 2,9 % más en México.
Portugal vs México: gasto militar en % del PIB, 1960–2025
| Año | % del PIB | |
|---|---|---|
|
Portugal
|
México
|
|
| 2025 | 1,7 % | 0,7 % |
| 2024 | 1,4 % | 1,1 % |
| 2023 | 1,2 % | 0,7 % |
| 2022 | 1,4 % | 0,7 % |
| 2021 | 1,5 % | 0,7 % |
| 2020 | 1,4 % | 0,7 % |
| 2019 | 1,4 % | 0,5 % |
| 2018 | 1,4 % | 0,5 % |
| 2017 | 1,5 % | 0,4 % |
| 2016 | 1,6 % | 0,5 % |
| 2015 | 1,6 % | 0,5 % |
| 2014 | 1,5 % | 0,5 % |
| 2013 | 1,7 % | 0,5 % |
| 2012 | 1,8 % | 0,5 % |
| 2011 | 1,6 % | 0,4 % |
| 2010 | 1,6 % | 0,4 % |
| 2009 | 1,5 % | 0,5 % |
| 2008 | 1,4 % | 0,4 % |
| 2007 | 1,4 % | 0,4 % |
| 2006 | 1,5 % | 0,3 % |
| 2005 | 1,6 % | 0,3 % |
| 2004 | 1,5 % | 0,3 % |
| 2003 | 1,4 % | 0,4 % |
| 2002 | 1,5 % | 0,4 % |
| 2001 | 1,4 % | 0,4 % |
| 2000 | 1,4 % | 0,4 % |
| 1999 | 1,4 % | 0,4 % |
| 1998 | 1,4 % | 0,4 % |
| 1997 | 1,5 % | 0,4 % |
| 1996 | 1,6 % | 0,4 % |
| 1995 | 1,7 % | 0,4 % |
| 1994 | 1,7 % | 0,5 % |
| 1993 | 1,8 % | 0,4 % |
| 1992 | 1,8 % | 0,5 % |
| 1991 | 1,8 % | 0,4 % |
| 1990 | 1,8 % | 0,4 % |
| 1989 | 1,9 % | 0,5 % |
| 1988 | 1,9 % | 0,5 % |
| 1987 | 1,9 % | 0,6 % |
| 1986 | 1,9 % | 0,6 % |
| 1985 | 1,8 % | 0,7 % |
| 1984 | 1,9 % | 0,7 % |
| 1983 | 1,9 % | 0,5 % |
| 1982 | 2 % | 0,5 % |
| 1981 | 2 % | 0,5 % |
| 1980 | 2 % | 0,4 % |
| 1979 | 2 % | 0,5 % |
| 1978 | 2,1 % | 0,5 % |
| 1977 | 2,1 % | 0,5 % |
| 1976 | 2,4 % | 0,6 % |
| 1975 | 3,1 % | 0,6 % |
| 1974 | 4,3 % | 0,6 % |
| 1973 | 3,5 % | 0,5 % |
| 1972 | 4,1 % | 0,5 % |
| 1971 | 4,3 % | 0,5 % |
| 1970 | 4,1 % | 0,5 % |
| 1969 | 4,1 % | 0,6 % |
| 1968 | 4,5 % | 0,5 % |
| 1967 | 4,5 % | 0,5 % |
| 1966 | 3,9 % | 0,6 % |
| 1965 | 3,8 % | 0,6 % |
| 1964 | 4,1 % | 0,7 % |
| 1963 | 4 % | 0,7 % |
| 1962 | 4,2 % | 0,7 % |
| 1961 | 3,9 % | 0,7 % |
| 1960 | 2,6 % | 0,7 % |
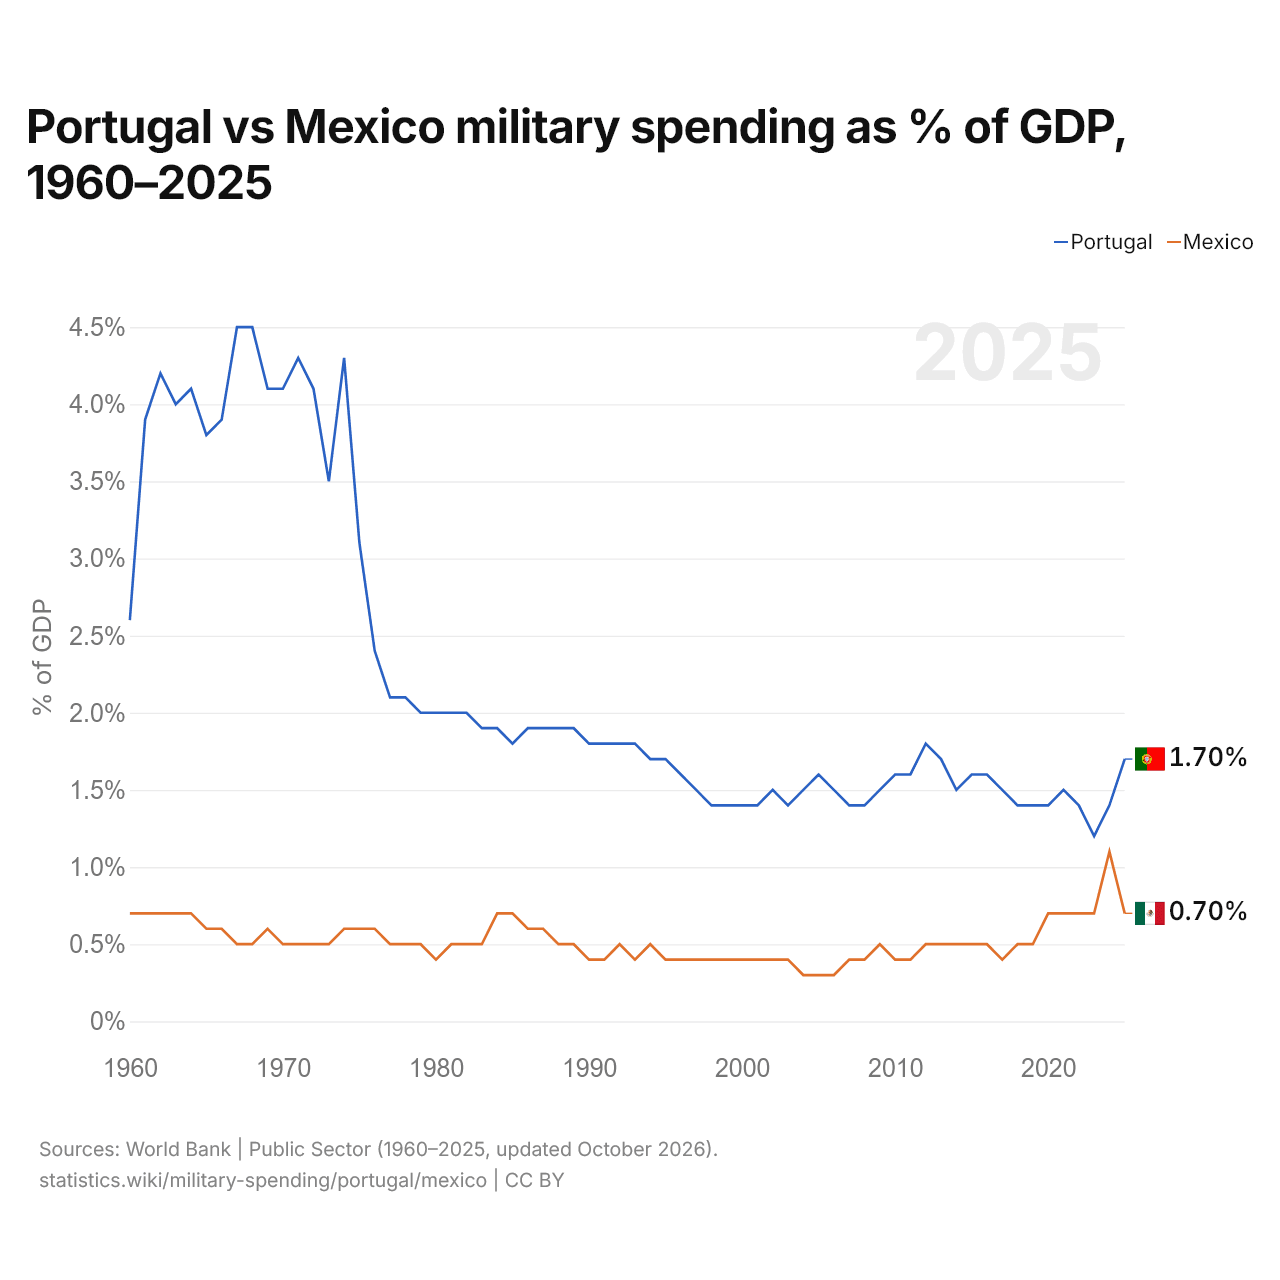
En 2025, el gasto militar fue del 1,7 % del PIB en Portugal y del 0,7 % en México: 1,0 puntos porcentuales más en Portugal. En 2015 fue del 1,6 % en Portugal y del 0,5 % en México, 1,1 puntos porcentuales más en Portugal.
El gasto militar de Portugal, como porcentaje del PIB, ha sido más alto que el de México todos los años desde 1960. La diferencia fue máxima en 1968, cuando el gasto militar de Portugal superó al de México en 4,0 puntos porcentuales del PIB.
Portugal vs México: datos del gasto militar
|
Portugal
|
México
|
|
|---|---|---|
| US$, 2025 | 5930 M US$ | 13,5 mil M US$ |
| % del PIB, 2025 | 1,7 % | 0,7 % |
| Por persona, US$ | 549 US$ | 102,3 US$ |
| Porcentaje del mundo | 0,21 % | 0,47 % |
| Puesto mundial | 46/154 | 30/154 |
Comparar el gasto militar de 2 países cualesquiera
Fuentes:
- Banco Mundial | Sector público (1960–2025, actualizado en octubre de 2026)
Creative Commons Atribución (CC BY): puedes copiar, compartir, adaptar y reutilizar este contenido, también con fines comerciales, siempre que cites a statistics.wiki e indiques los cambios que hayas hecho. Las fuentes indicadas arriba pueden tener sus propias condiciones de licencia.