
Portugal vs Italia: gasto militar (US$), 1960–2025
| Año | US$ | |
|---|---|---|
 Portugal |
 Italia |
|
| 2025 | 5.931.729.151 US$ | 48.191.950.223 US$ |
| 2024 | 4.529.704.001 US$ | 37.891.046.740 US$ |
| 2023 | 3.531.855.845 US$ | 35.539.882.188 US$ |
| 2022 | 3.488.539.557 US$ | 33.705.138.369 US$ |
| 2021 | 3.881.044.054 US$ | 35.042.939.552 US$ |
| 2020 | 3.298.548.143 US$ | 31.709.876.816 US$ |
| 2019 | 3.301.778.119 US$ | 25.204.296.904 US$ |
| 2018 | 3.363.358.444 US$ | 27.720.190.921 US$ |
| 2017 | 3.223.432.269 US$ | 25.318.414.528 US$ |
| 2016 | 3.236.363.321 US$ | 24.466.986.405 US$ |
| 2015 | 3.134.862.102 US$ | 21.758.102.542 US$ |
| 2014 | 3.440.418.481 US$ | 27.182.587.397 US$ |
| 2013 | 3.807.448.795 US$ | 29.965.955.446 US$ |
| 2012 | 3.946.356.885 US$ | 29.779.320.055 US$ |
| 2011 | 3.847.642.710 US$ | 33.873.119.723 US$ |
| 2010 | 3.809.844.557 US$ | 32.052.063.964 US$ |
| 2009 | 3.787.950.101 US$ | 34.191.528.917 US$ |
| 2008 | 3.729.835.869 US$ | 36.989.117.642 US$ |
| 2007 | 3.313.815.899 US$ | 32.024.755.220 US$ |
| 2006 | 3.156.575.442 US$ | 29.659.374.964 US$ |
| 2005 | 3.143.816.118 US$ | 29.749.474.102 US$ |
| 2004 | 2.852.268.012 US$ | 30.315.407.065 US$ |
| 2003 | 2.368.649.861 US$ | 26.884.475.683 US$ |
| 2002 | 1.974.502.384 US$ | 21.712.045.457 US$ |
| 2001 | 1.757.254.567 US$ | 19.536.460.030 US$ |
| 2000 | 1.668.817.718 US$ | 19.928.200.276 US$ |
| 1999 | 1.818.071.791 US$ | 21.024.160.491 US$ |
| 1998 | 1.763.779.417 US$ | 20.824.567.972 US$ |
| 1997 | 1.803.865.596 US$ | 20.155.552.296 US$ |
| 1996 | 1.964.092.952 US$ | 20.792.241.686 US$ |
| 1995 | 2.016.529.150 US$ | 17.185.321.883 US$ |
| 1994 | 1.675.978.156 US$ | 18.881.163.591 US$ |
| 1993 | 1.697.355.931 US$ | 19.072.186.259 US$ |
| 1992 | 1.942.300.007 US$ | 23.182.235.663 US$ |
| 1991 | 1.632.934.517 US$ | 23.218.788.335 US$ |
| 1990 | 1.448.986.877 US$ | 22.267.621.236 US$ |
| 1989 | 1.143.715.092 US$ | 18.862.020.125 US$ |
| 1988 | 1.062.385.978 US$ | 18.524.379.534 US$ |
| 1987 | 895.866.142 US$ | 16.638.800.693 US$ |
| 1986 | 742.303.840 US$ | 12.690.533.500 US$ |
| 1985 | 499.891.677 US$ | 8.776.781.153 US$ |
| 1984 | 469.387.961 US$ | 8.815.717.870 US$ |
| 1983 | 520.080.316 US$ | 8.954.546.721 US$ |
| 1982 | 621.280.577 US$ | 8.588.158.289 US$ |
| 1981 | 640.400.558 US$ | 7.861.661.357 US$ |
| 1980 | 666.721.962 US$ | 8.436.506.569 US$ |
| 1979 | 540.076.076 US$ | 7.394.353.725 US$ |
| 1978 | 491.803.631 US$ | 5.935.974.686 US$ |
| 1977 | 443.842.908 US$ | 4.881.878.871 US$ |
| 1976 | 479.518.714 US$ | 4.117.623.156 US$ |
| 1975 | 598.829.369 US$ | 4.507.887.565 US$ |
| 1974 | 760.437.048 US$ | 4.141.759.708 US$ |
| 1973 | 525.085.622 US$ | 3.862.366.624 US$ |
| 1972 | 456.425.548 US$ | 3.481.428.752 US$ |
| 1971 | 398.591.949 US$ | 2.797.811.667 US$ |
| 1970 | 335.509.119 US$ | 2.339.293.004 US$ |
| 1969 | 301.633.114 US$ | 2.446.544.102 US$ |
| 1968 | 299.198.281 US$ | 2.423.414.384 US$ |
| 1967 | 267.943.783 US$ | 2.336.033.650 US$ |
| 1966 | 206.904.664 US$ | 2.290.030.317 US$ |
| 1965 | 186.932.305 US$ | 1.943.006.598 US$ |
| 1964 | 182.106.546 US$ | 1.792.439.346 US$ |
| 1963 | 161.564.384 US$ | 1.653.051.934 US$ |
| 1962 | 162.130.284 US$ | 1.380.496.682 US$ |
| 1961 | 138.928.393 US$ | 1.200.696.728 US$ |
| 1960 | 85.337.685 US$ | 1.140.144.043 US$ |
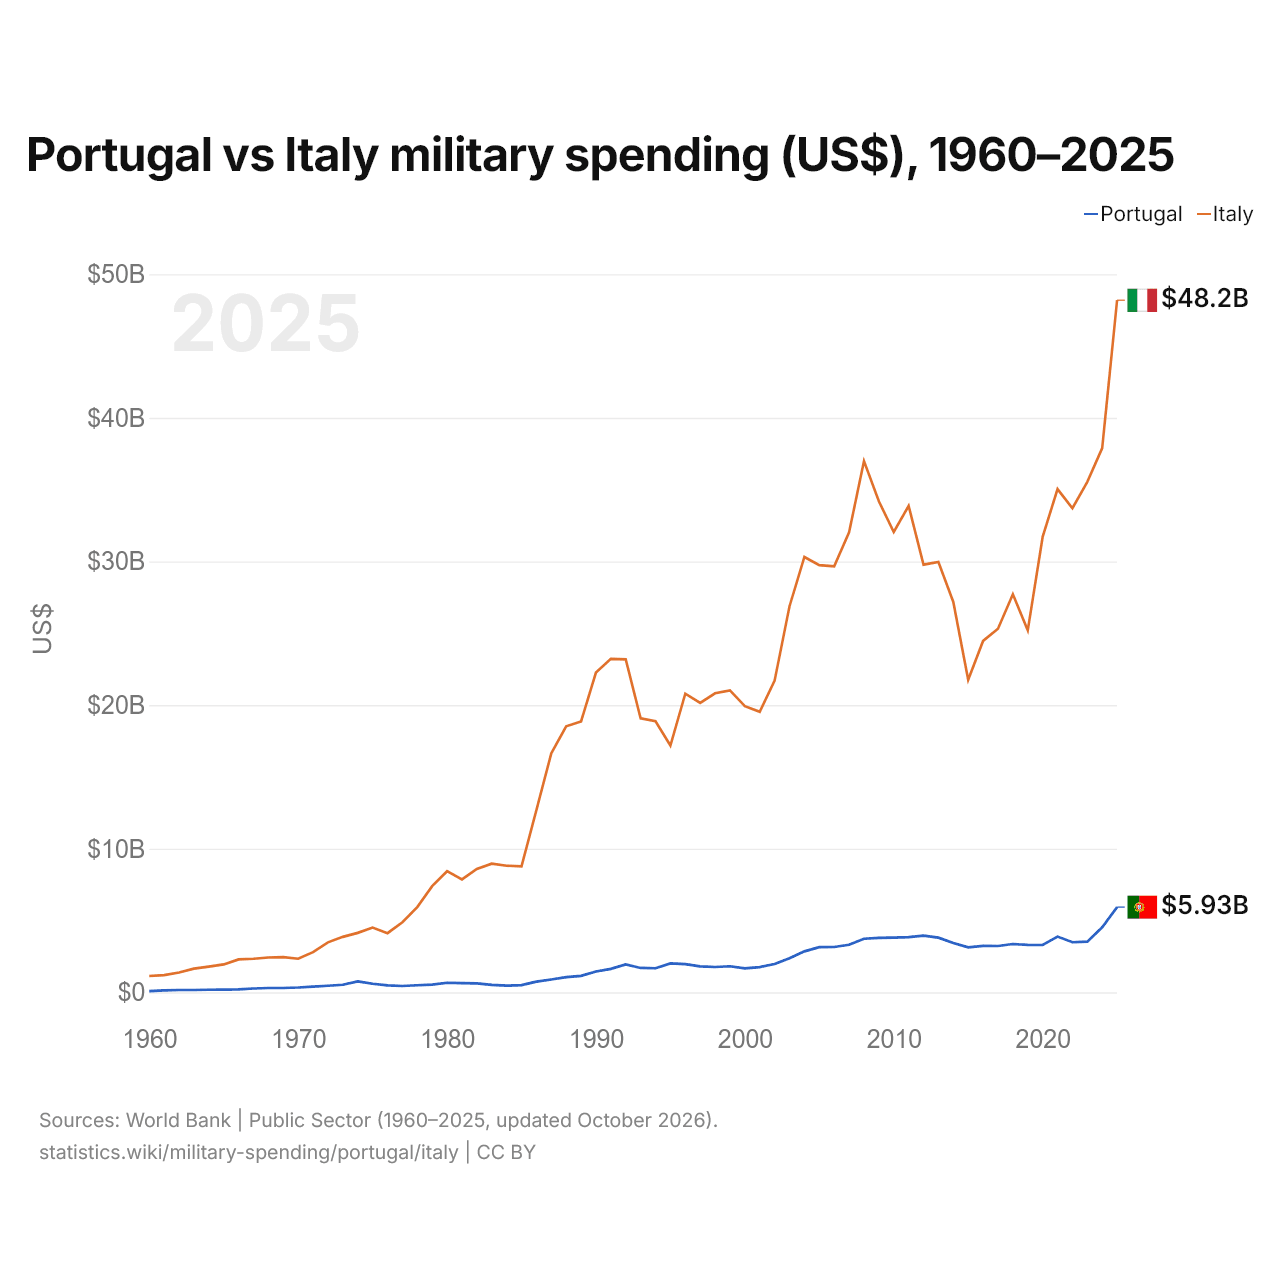
En 2025, el gasto militar fue de 5,93 mil millones de US$ en Portugal y de 48,2 mil millones de US$ en Italia: 8,1 veces más en Italia. En 1960 fue de 85,3 millones de US$ en Portugal y de 1,14 mil millones de US$ en Italia, 13 veces más en Italia.
Portugal vs Italia: gasto militar en % del PIB, 1960–2025
| Año | % del PIB | |
|---|---|---|
|
Portugal
|
Italia
|
|
| 2025 | 1,7 % | 1,9 % |
| 2024 | 1,4 % | 1,6 % |
| 2023 | 1,2 % | 1,5 % |
| 2022 | 1,4 % | 1,6 % |
| 2021 | 1,5 % | 1,6 % |
| 2020 | 1,4 % | 1,7 % |
| 2019 | 1,4 % | 1,2 % |
| 2018 | 1,4 % | 1,3 % |
| 2017 | 1,5 % | 1,3 % |
| 2016 | 1,6 % | 1,3 % |
| 2015 | 1,6 % | 1,2 % |
| 2014 | 1,5 % | 1,3 % |
| 2013 | 1,7 % | 1,4 % |
| 2012 | 1,8 % | 1,4 % |
| 2011 | 1,6 % | 1,5 % |
| 2010 | 1,6 % | 1,5 % |
| 2009 | 1,5 % | 1,5 % |
| 2008 | 1,4 % | 1,5 % |
| 2007 | 1,4 % | 1,4 % |
| 2006 | 1,5 % | 1,5 % |
| 2005 | 1,6 % | 1,6 % |
| 2004 | 1,5 % | 1,7 % |
| 2003 | 1,4 % | 1,7 % |
| 2002 | 1,5 % | 1,7 % |
| 2001 | 1,4 % | 1,7 % |
| 2000 | 1,4 % | 1,7 % |
| 1999 | 1,4 % | 1,7 % |
| 1998 | 1,4 % | 1,6 % |
| 1997 | 1,5 % | 1,6 % |
| 1996 | 1,6 % | 1,6 % |
| 1995 | 1,7 % | 1,5 % |
| 1994 | 1,7 % | 1,7 % |
| 1993 | 1,8 % | 1,8 % |
| 1992 | 1,8 % | 1,8 % |
| 1991 | 1,8 % | 1,9 % |
| 1990 | 1,8 % | 1,9 % |
| 1989 | 1,9 % | 2 % |
| 1988 | 1,9 % | 2,1 % |
| 1987 | 1,9 % | 2,1 % |
| 1986 | 1,9 % | 2 % |
| 1985 | 1,8 % | 1,9 % |
| 1984 | 1,9 % | 2 % |
| 1983 | 1,9 % | 2 % |
| 1982 | 2 % | 2 % |
| 1981 | 2 % | 1,8 % |
| 1980 | 2 % | 1,8 % |
| 1979 | 2 % | 1,9 % |
| 1978 | 2,1 % | 1,9 % |
| 1977 | 2,1 % | 1,9 % |
| 1976 | 2,4 % | 1,8 % |
| 1975 | 3,1 % | 2 % |
| 1974 | 4,3 % | 2,1 % |
| 1973 | 3,5 % | 2,2 % |
| 1972 | 4,1 % | 2,4 % |
| 1971 | 4,3 % | 2,2 % |
| 1970 | 4,1 % | 2,1 % |
| 1969 | 4,1 % | 2,4 % |
| 1968 | 4,5 % | 2,6 % |
| 1967 | 4,5 % | 2,8 % |
| 1966 | 3,9 % | 3 % |
| 1965 | 3,8 % | 2,7 % |
| 1964 | 4,1 % | 2,7 % |
| 1963 | 4 % | 2,8 % |
| 1962 | 4,2 % | 2,6 % |
| 1961 | 3,9 % | 2,6 % |
| 1960 | 2,6 % | 2,7 % |
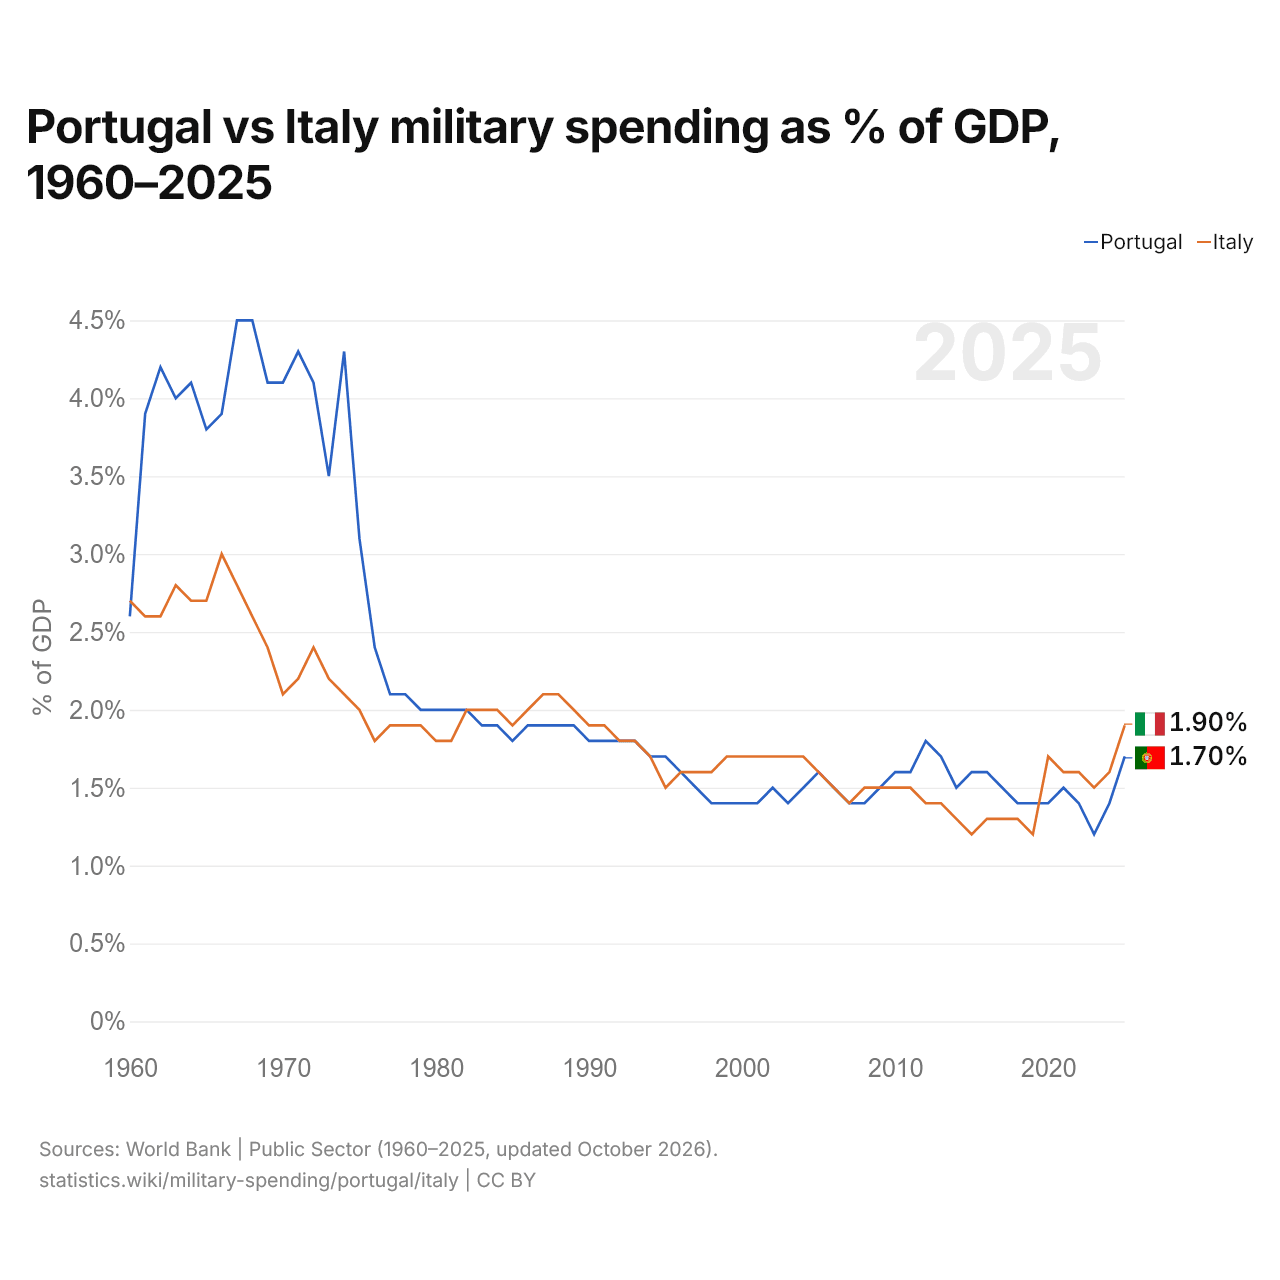
En 2025, el gasto militar fue del 1,7 % del PIB en Portugal y del 1,9 % en Italia: 0,2 puntos porcentuales más en Italia. En 2015 fue del 1,6 % en Portugal y del 1,2 % en Italia, 0,4 puntos porcentuales más en Portugal.
El gasto militar de Italia, como porcentaje del PIB, ha sido más alto que el de Portugal todos los años desde 2020. La diferencia fue máxima en 1974, cuando el gasto militar de Portugal superó al de Italia en 2,2 puntos porcentuales del PIB.
Portugal vs Italia: datos del gasto militar
|
Portugal
|
Italia
|
|
|---|---|---|
| US$, 2025 | 5930 M US$ | 48,2 mil M US$ |
| % del PIB, 2025 | 1,7 % | 1,9 % |
| Por persona, US$ | 549 US$ | 818 US$ |
| Porcentaje del mundo | 0,21 % | 1,69 % |
| Puesto mundial | 46/154 | 12/154 |
Comparar el gasto militar de 2 países cualesquiera
Fuentes:
- Banco Mundial | Sector público (1960–2025, actualizado en octubre de 2026)
Creative Commons Atribución (CC BY): puedes copiar, compartir, adaptar y reutilizar este contenido, también con fines comerciales, siempre que cites a statistics.wiki e indiques los cambios que hayas hecho. Las fuentes indicadas arriba pueden tener sus propias condiciones de licencia.